Figure 8. Expression of CrybA2, Rpe65, Slc24a5, Cp, and Tyr by quantitative real-time PCR (qRT-PCR) of the retina in 12 months old WNIN/GR-Ob
rat. Data represent fold change (mean ± standard deviation [SD]) over respective age-matched lean rats (n = 3; “*” p<0.05).
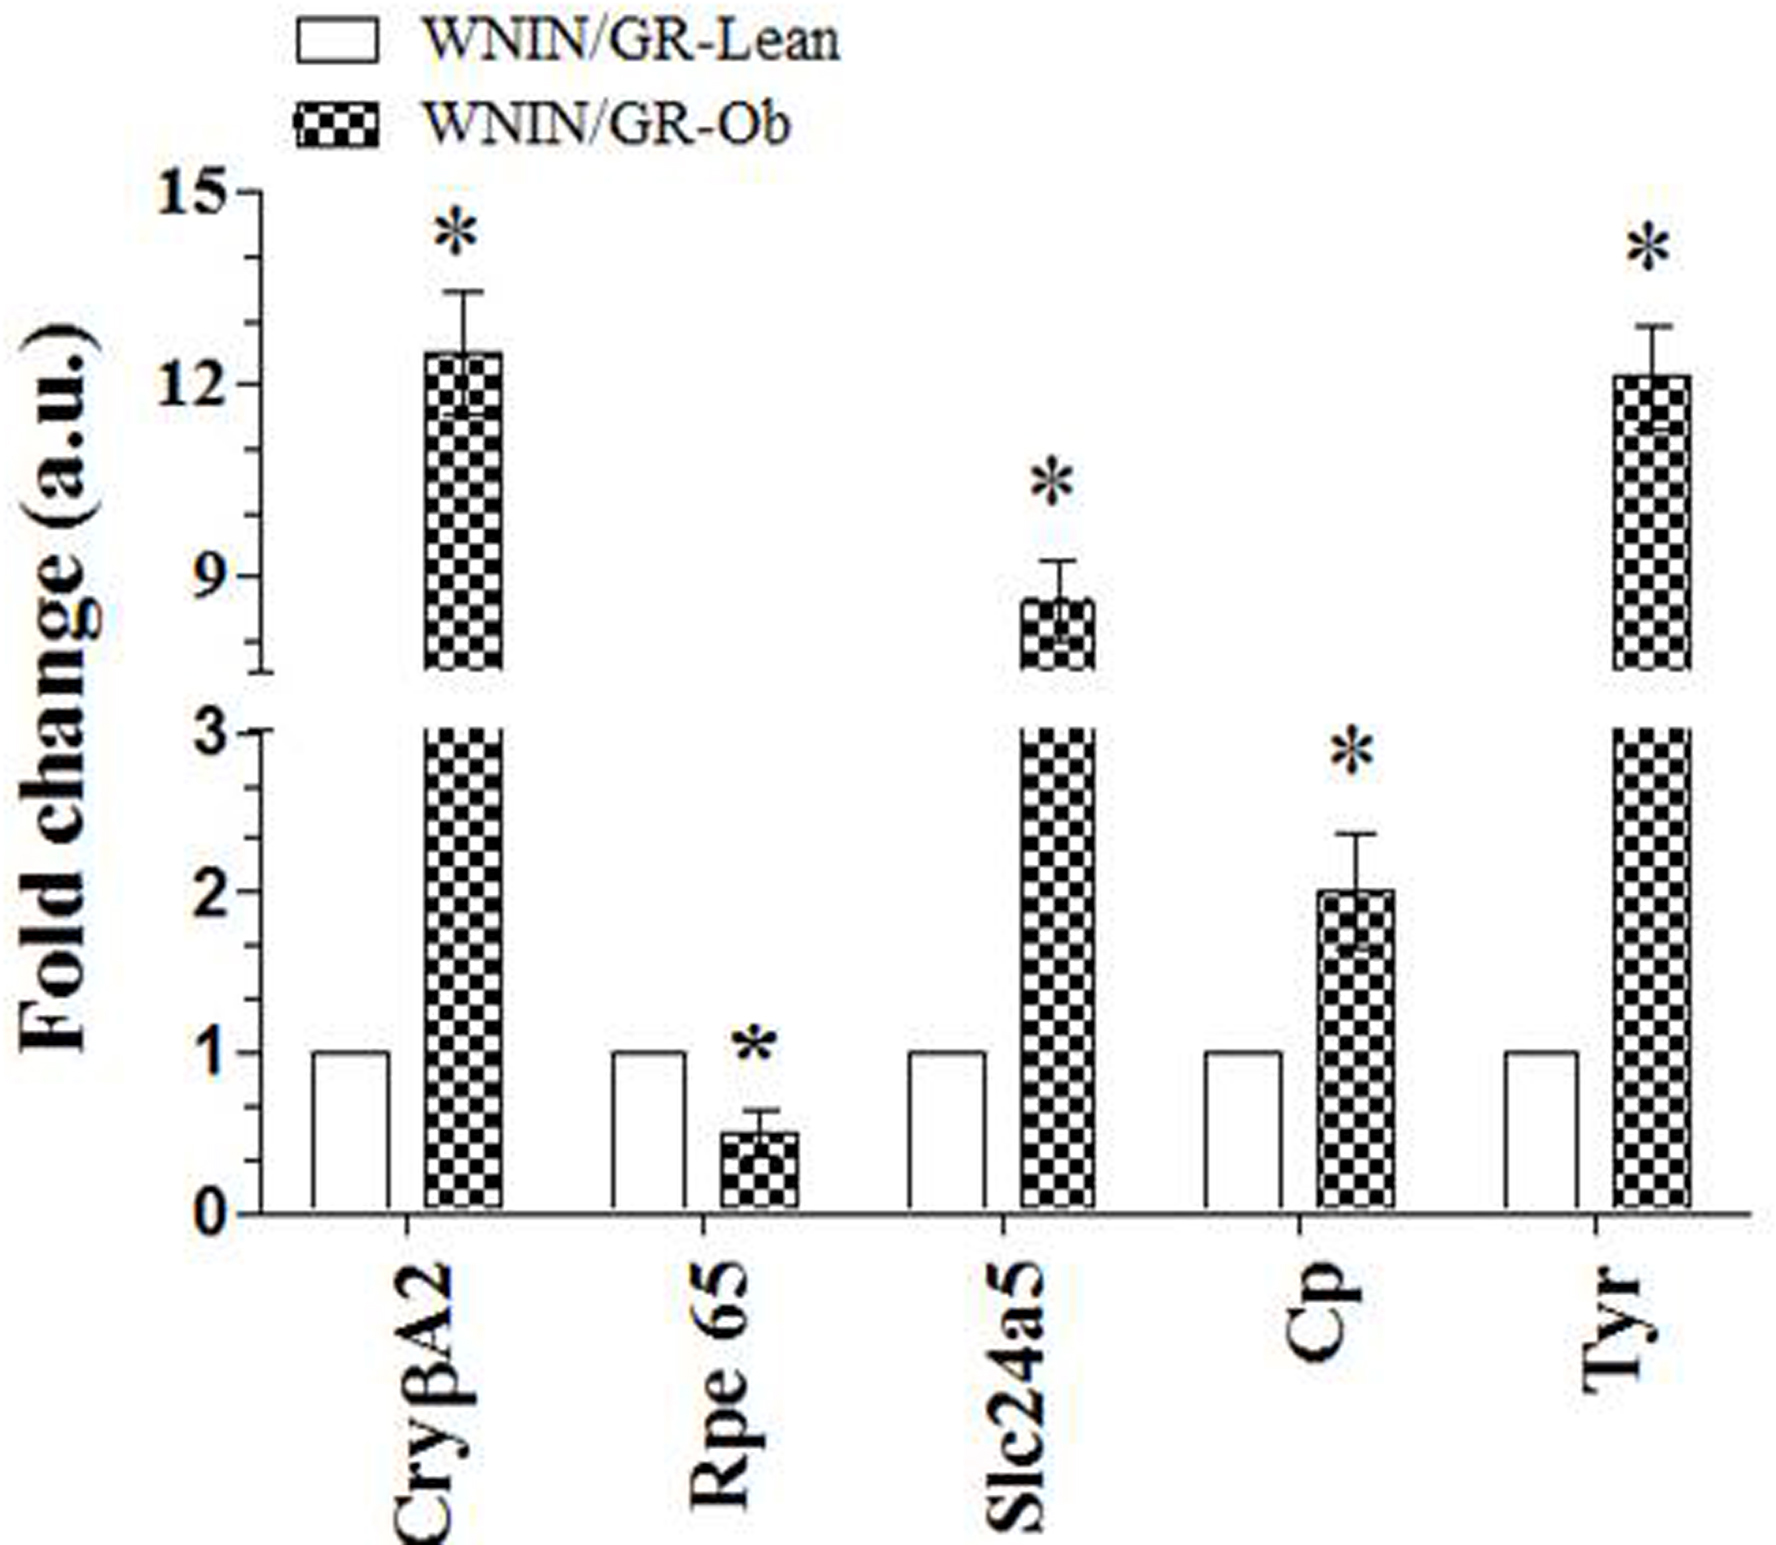
 Figure 8 of
Godisela, Mol Vis 2017; 23:263-274.
Figure 8 of
Godisela, Mol Vis 2017; 23:263-274.