Figure 4. Expression of rod-specific genes by quantitative real-time PCR (qRT-PCR). A: Rho, B: Sag, C: Gnat1 and D: Pde-6b in 3-, 6-, 12-, and 15-month-old WNIN/GR-Ob rats. The expression value of each bar was compared to its respective
age-matched lean rat which is taken as 1 (or 100%) for calculating the fold change. Data represent fold change (mean ± standard
deviation [SD]) over respective age-matched lean rats (n = 3; “*” p<0.05). “*” significantly different from the respective
age-matched lean rats at p≤0.05.
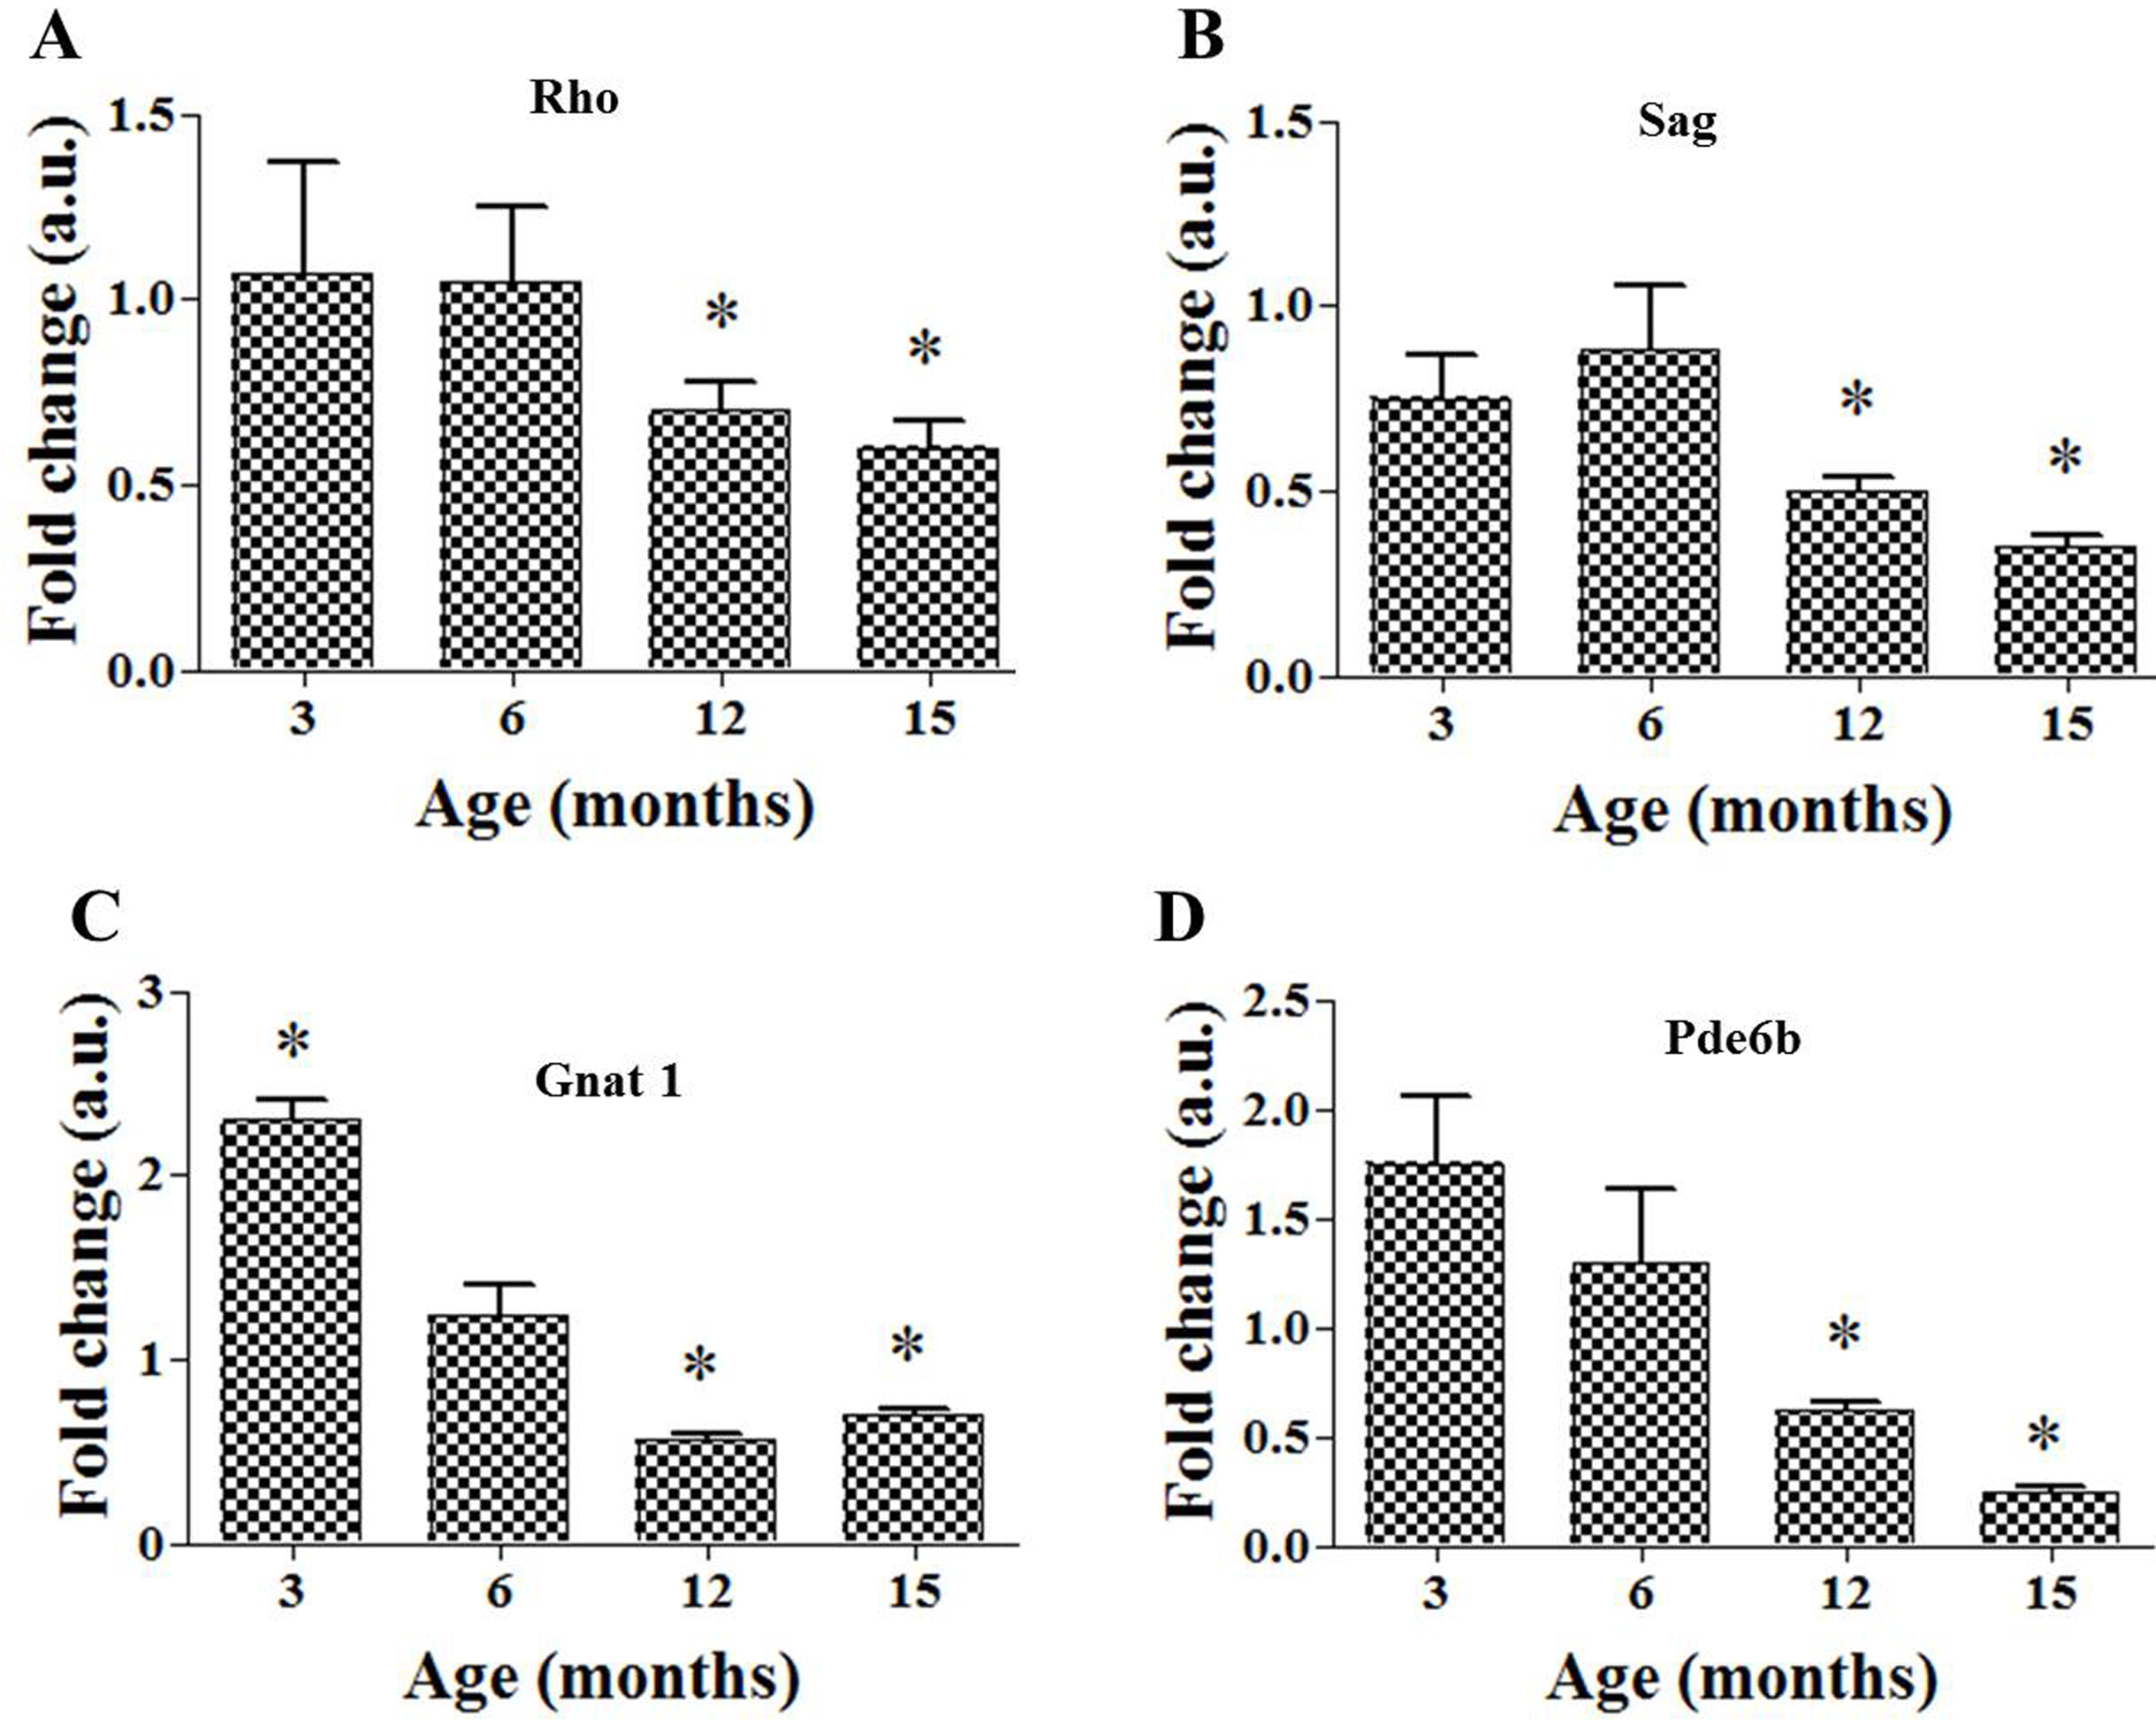
 Figure 4 of
Godisela, Mol Vis 2017; 23:263-274.
Figure 4 of
Godisela, Mol Vis 2017; 23:263-274.