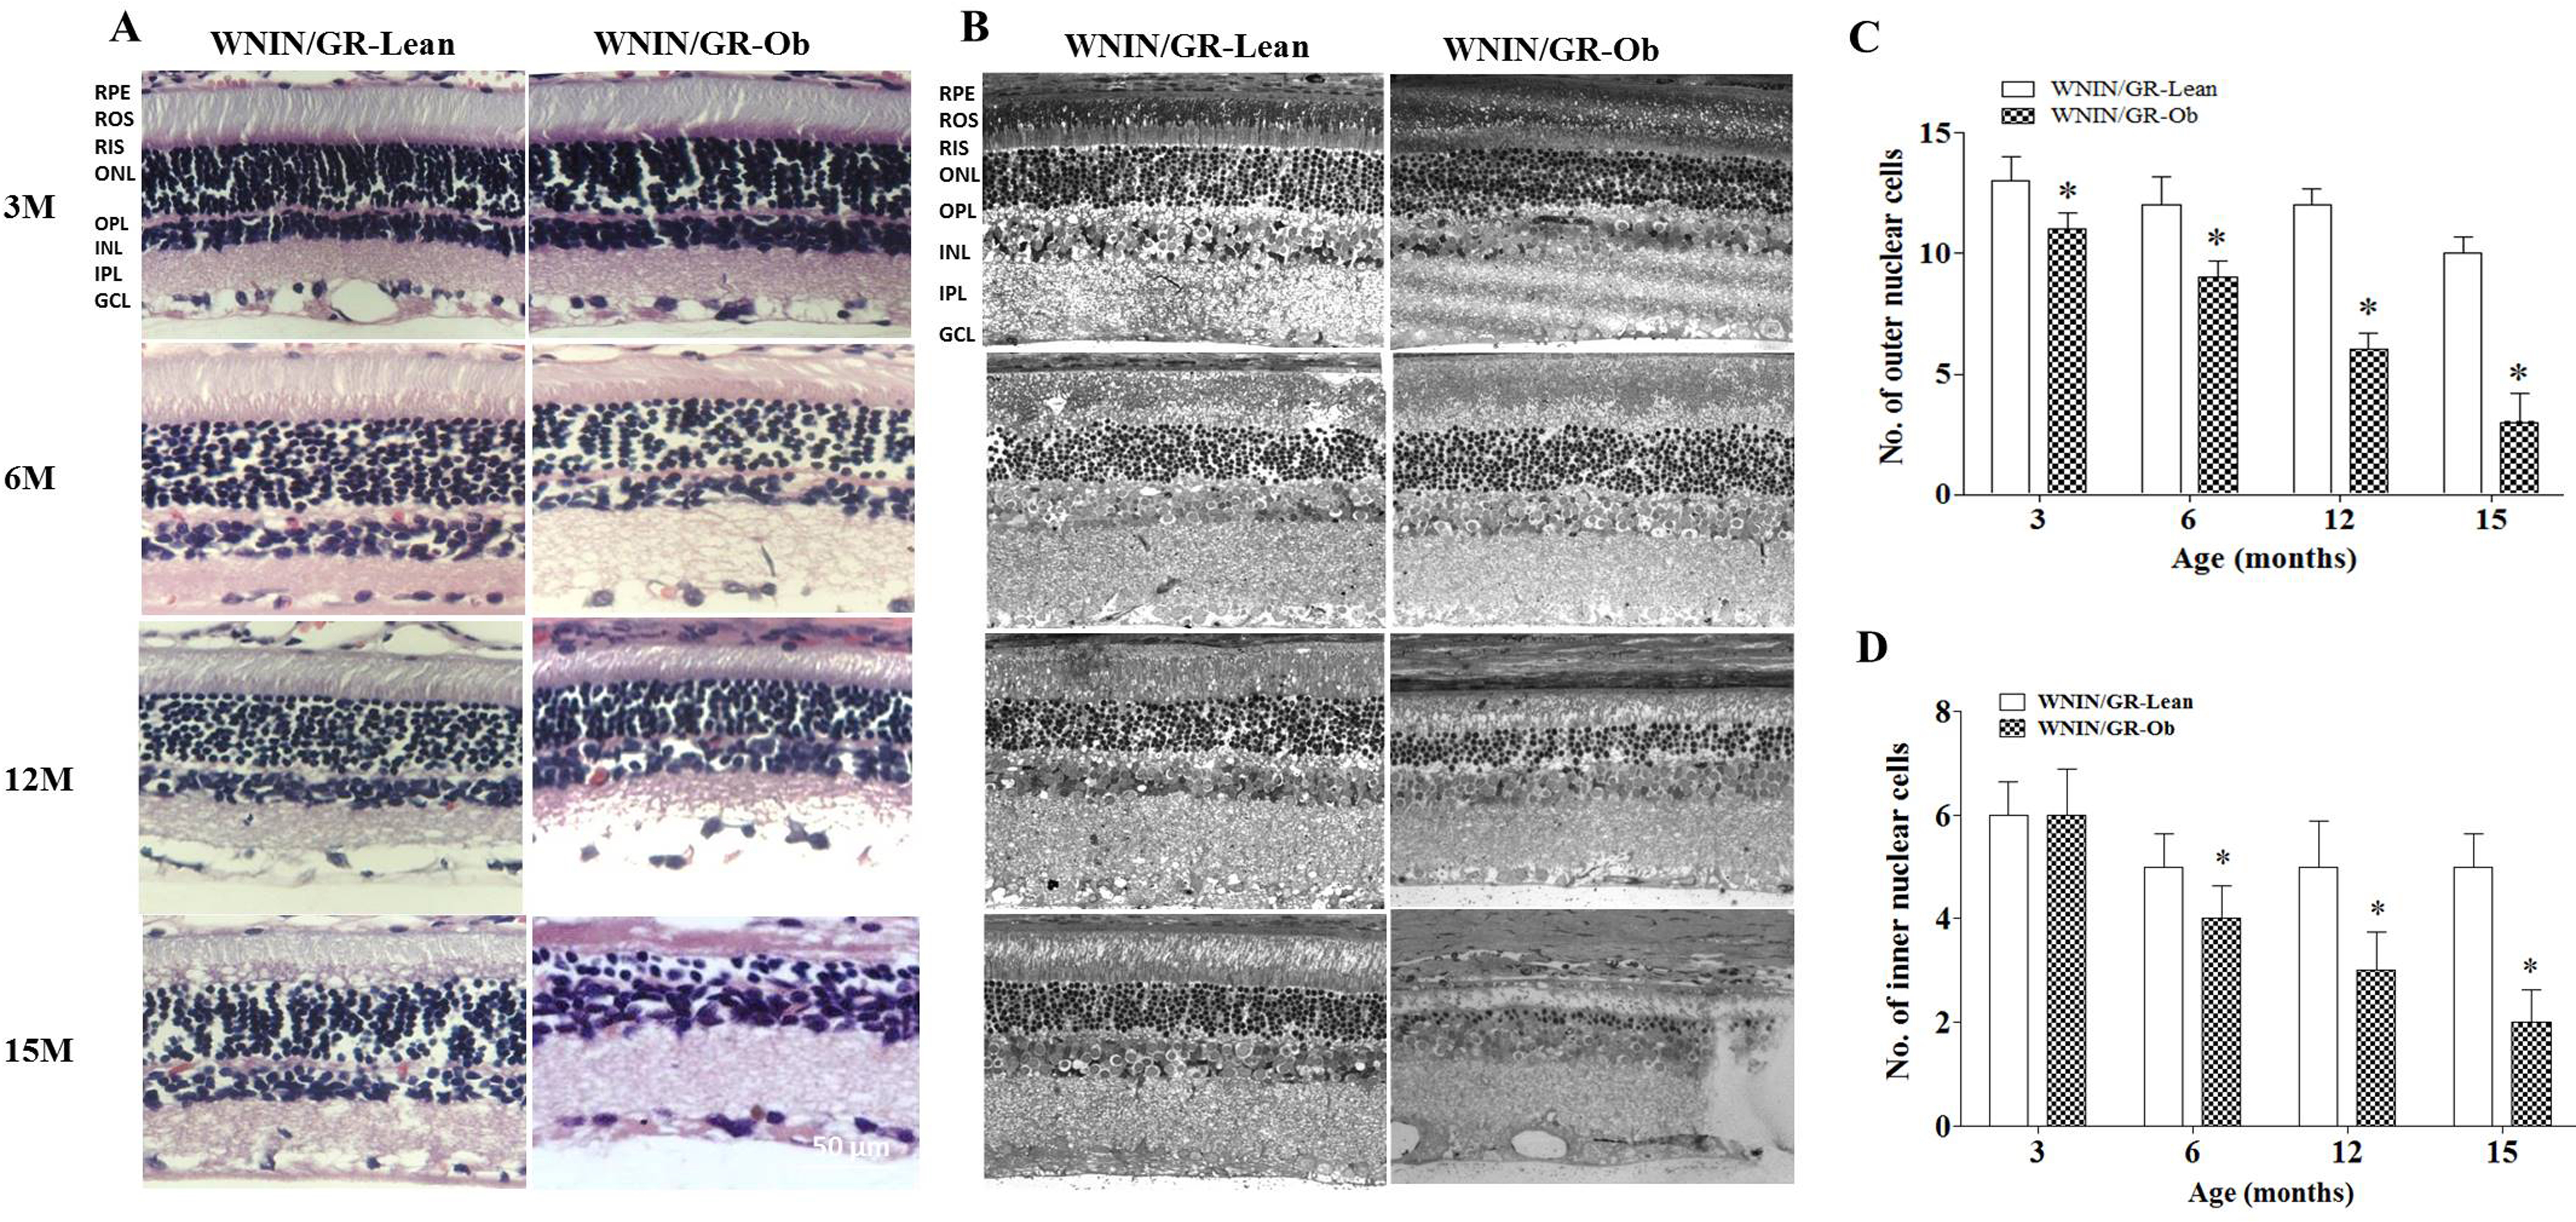
Figure 1. Histology of the retina in various age groups. A: Representative hematoxylin and eosin (H&E) images of the WNIN/GR-Ob rat retina at 3, 6, 12, and 15 months of age in comparison
with age-matched lean rats. B: Representative ultrastructural (electron microscope) images. Histograms summarizing the number of cells in the ONL (C) and INL (D) of the central retina of WNIN/GR-Ob rats compared to respective age-matched lean rats based on H&E analyses. Values represent
mean ± standard deviation (SD; n = 3; “*” significantly different from their respective lean rats at p≤0.05). ROS, retinal outer segment; RIS, retinal inner
segment; ONL, outer nuclear layer; OPL, outer plexiform layer; INL, inner nuclear layer; IPL, inner plexiform layer; GC, ganglion
cell layer.

 Figure 1 of
Godisela, Mol Vis 2017; 23:263-274.
  Figure 1 of
Godisela, Mol Vis 2017; 23:263-274.