Figure 4. Quantification of 8-OHdG, 3-nitrotyrosine, and AGEs in the RPE of Atg5ΔRPE and Atg7ΔRPE mice. The immunofluorescence staining of 8-OHdG, 3-nitrotyrosine, and advanced glycation end products (AGEs) in the RPE was
quantified using Image J software. n = 3 mice per genotype. Error bars indicate the mean ± standard deviation (SD). WT, wild-type
control.
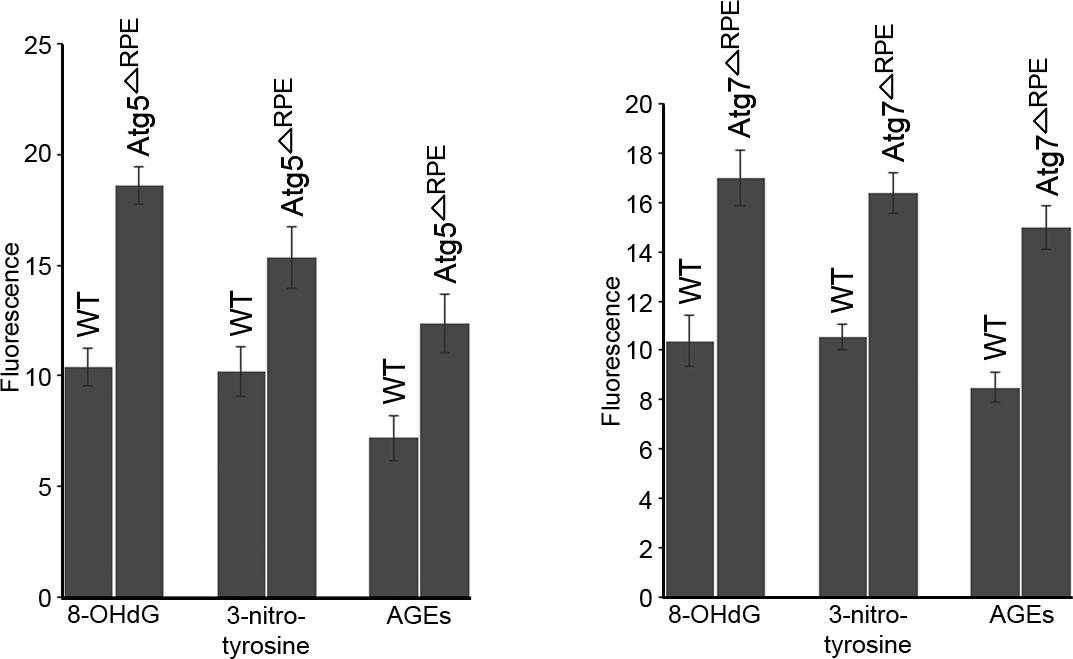
 Figure 4 of
Zhang, Mol Vis 2017; 23:228-241.
Figure 4 of
Zhang, Mol Vis 2017; 23:228-241.