Figure 1. DNA melting curve analysis for the RB1 and TP53 genes. The change in fluorescence with increasing temperature was measured. As the temperature increased, the strands of
the amplicon separate to form single-stranded DNA, causing the fluorescent intercalating dye to dissociate from the DNA and
stop fluorescing. HET, heterozygote; WH, wild homozygous; MH, mutated homozygote.
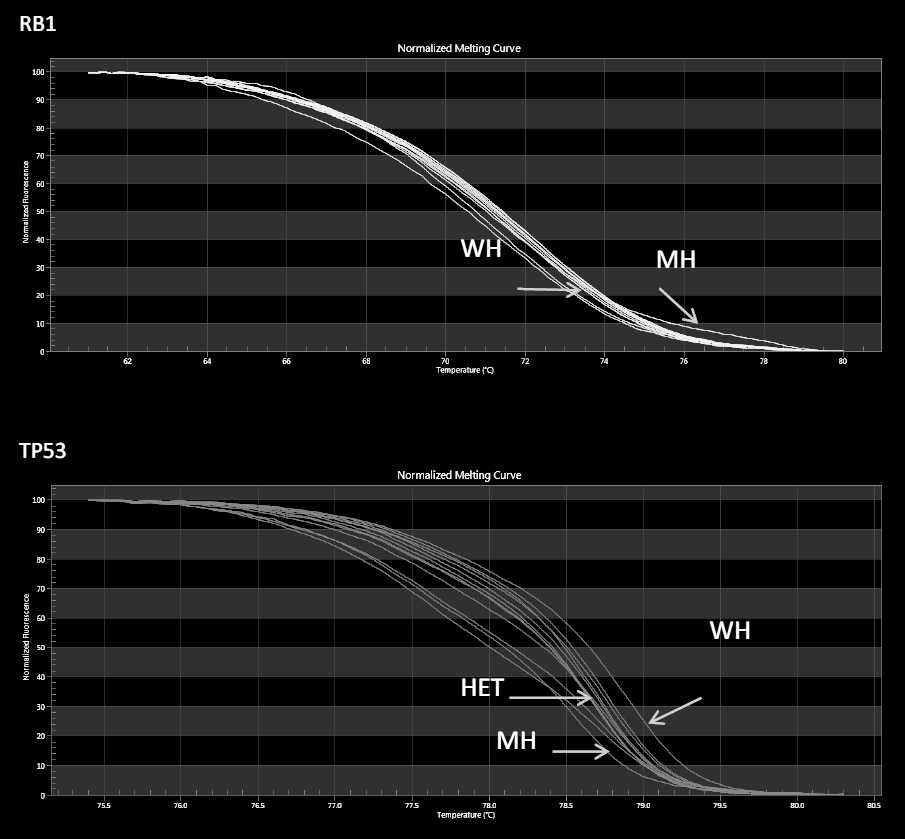
 Figure 1 of
Anaya-Pava, Mol Vis 2017; 23:20-25.
Figure 1 of
Anaya-Pava, Mol Vis 2017; 23:20-25.