Figure 4. Graphs showing relative antioxidant mRNA levels measured by qPCR. Relative mRNA levels were measured after mice received IP
injections for 7 days but no LD, or 24 h after LD. Sod1 and Gpx4 mRNA levels were not significantly changed in the neural retinas of mice in the daily IP EGCG group versus mice in the saline
groups (A, C). Sod2 mRNA levels in the neural retina increased after 7 days of daily IP EGCG administration compared with the saline control.
Sod2 mRNA levels in the NSR of mice receiving daily IP EGCG versus IP saline were upregulated 24 h after LD (B).The mRNA levels for the indicated genes in the retinas from mice in the no IP NLD (n = 4), saline IP + NLD (n = 5), EGCG
IP + NLD (n = 5), saline IP + LD (n = 4), and EGCG IP + LD (n = 4) groups are displayed as mean values (± SEM). * p < 0.05
and** p < 0.01. In A, (Saline IP+LD) vs (EGCG IP+LD) (Unpaired t test, p= 0.0914); in C, (Saline IP+NLD) vs (EGCG IP+NLD; Unpaired t test, p= 0.3101), Saline IP+LD vs EGCG IP+LD (Unpaired t test, p= 0.2304).
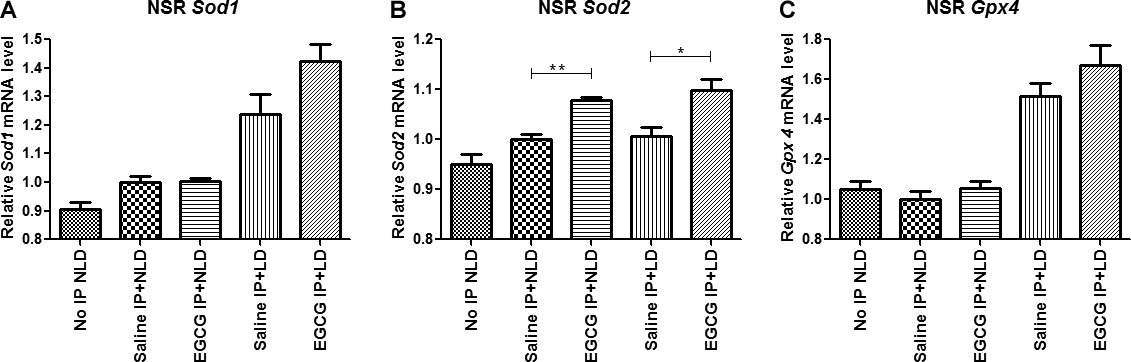
 Figure 4 of
Qi, Mol Vis 2017; 23:171-178.
Figure 4 of
Qi, Mol Vis 2017; 23:171-178.