Figure 3. Full-field ERG responses of mice in the EGCG-treated and saline control groups 7 days after light exposure. The maximum amplitude
ERG responses were compared. The amplitudes of three wave types were significantly higher in the LD EGCG-treated group compared
with the LD saline control group (A-C). Numbers represent mean values (± SEM). * p < 0.05 and ** p < 0.01. Representative ERG traces from each group were plotted
in D (rod b), E (rod a), and F (cone b).
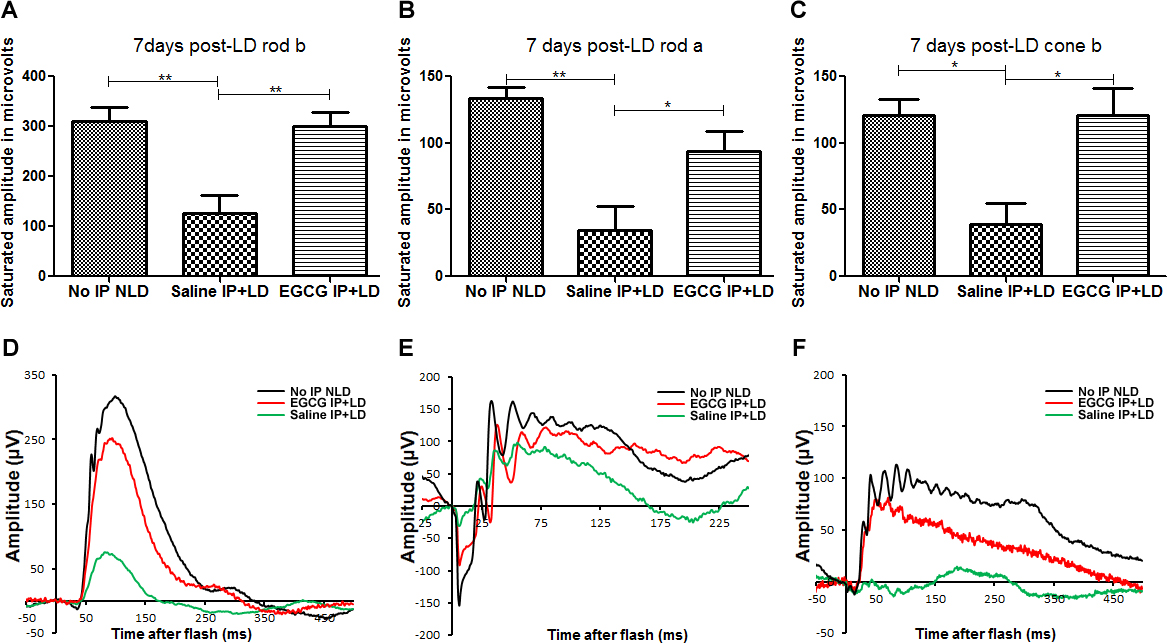
 Figure 3 of
Qi, Mol Vis 2017; 23:171-178.
Figure 3 of
Qi, Mol Vis 2017; 23:171-178.