Figure 2. Photomicrographs of plastic sections of mouse retinas 7 days after LD. The sagittal plane sections pass through the optic
nerve. A: Posterior retina from a mouse that received NLD. B: The retina of a mouse in the saline plus LD group showed ONL thinning 7 days after LD. C: In the retina of a mouse in the EGCG plus LD group, the photoreceptor nuclei in the ONL were well protected from light-induced
damage, especially in the superior area (scale bars = 100 µm). D-F: High magnification images of A-C (scale bars = 25 µm). G: Plots of the thickness of the ONL, measured in numbers of photoreceptor nuclei per column. Measurements were made in triplicate
at intervals of 200 µm from the optic nerve, which is reference point 0 on the x-axis. No IP NLD (n = 4, black), saline IP
+ LD (n = 4, green), and EGCG IP + LD (n = 4, red). Numbers represent mean values (± SEM). GCL = ganglion cell layer, IPL
= inner plexiform layer, INL = inner nuclear layer, OPL = outer plexiform layer, ONL = outer nuclear layer, and SEM = standard
error of the mean.
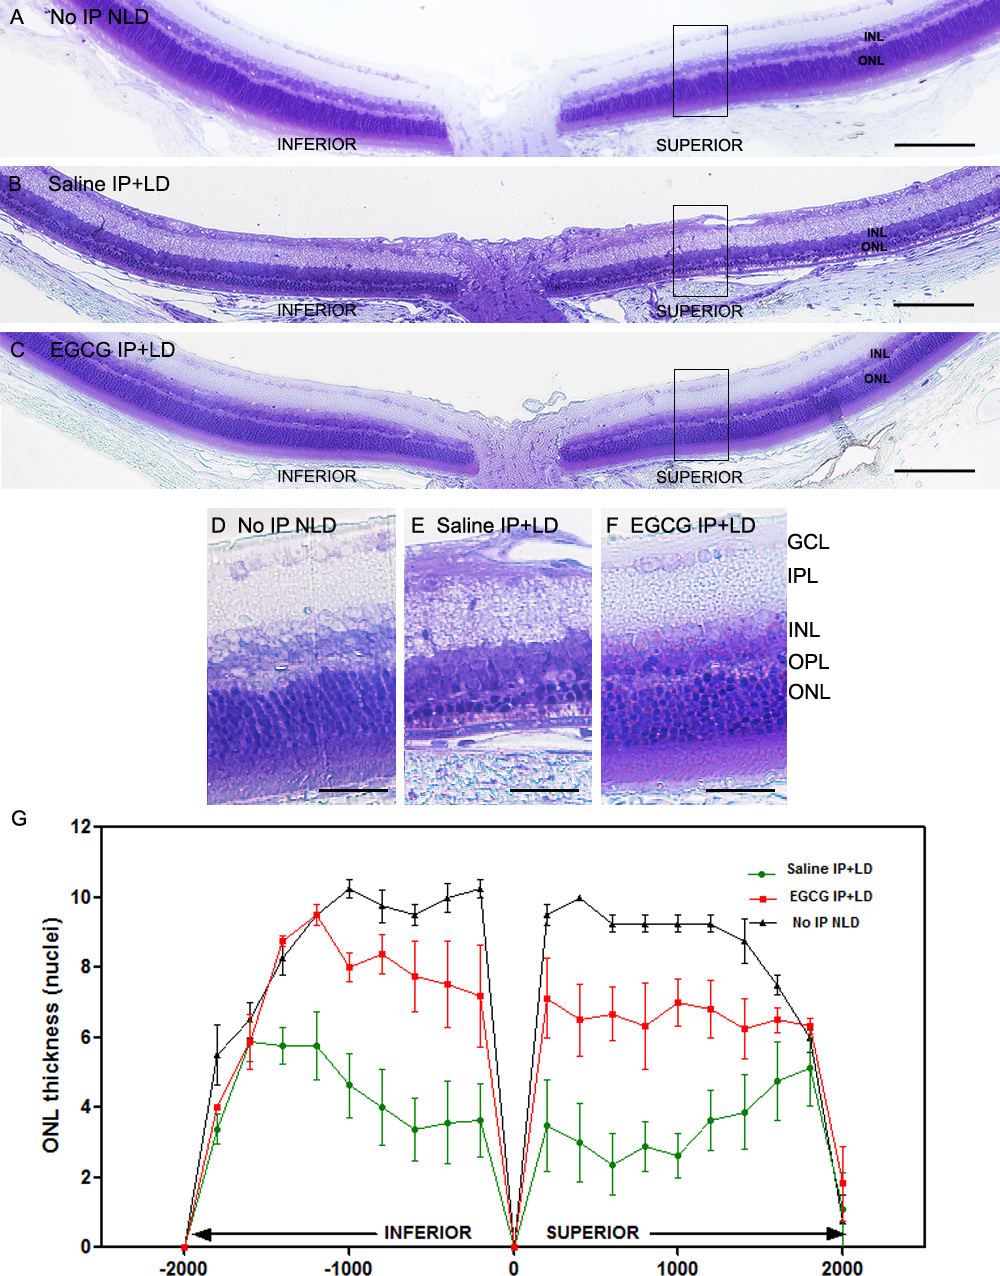
 Figure 2 of
Qi, Mol Vis 2017; 23:171-178.
Figure 2 of
Qi, Mol Vis 2017; 23:171-178.