Figure 1. OCT images of mouse retinas. A: The retina of a mouse that received no IP injection and NLD. B: The retina of a mouse that received IP saline and LD showed ONL thinning 7 days after LD. C: The retina of a mouse that received IP EGCG and LD showed nearly normal thickness ONL 7 days after LD. D: A comparison of relative ONL thickness: No IP NLD (n = 4); saline IP + LD (n = 4), and EGCG IP + LD (n = 4). Numbers represent
mean values (± SEM). ** p < 0.01. ONL = outer nuclear layer, INL = inner nuclear layer, and SEM = standard error of the mean.
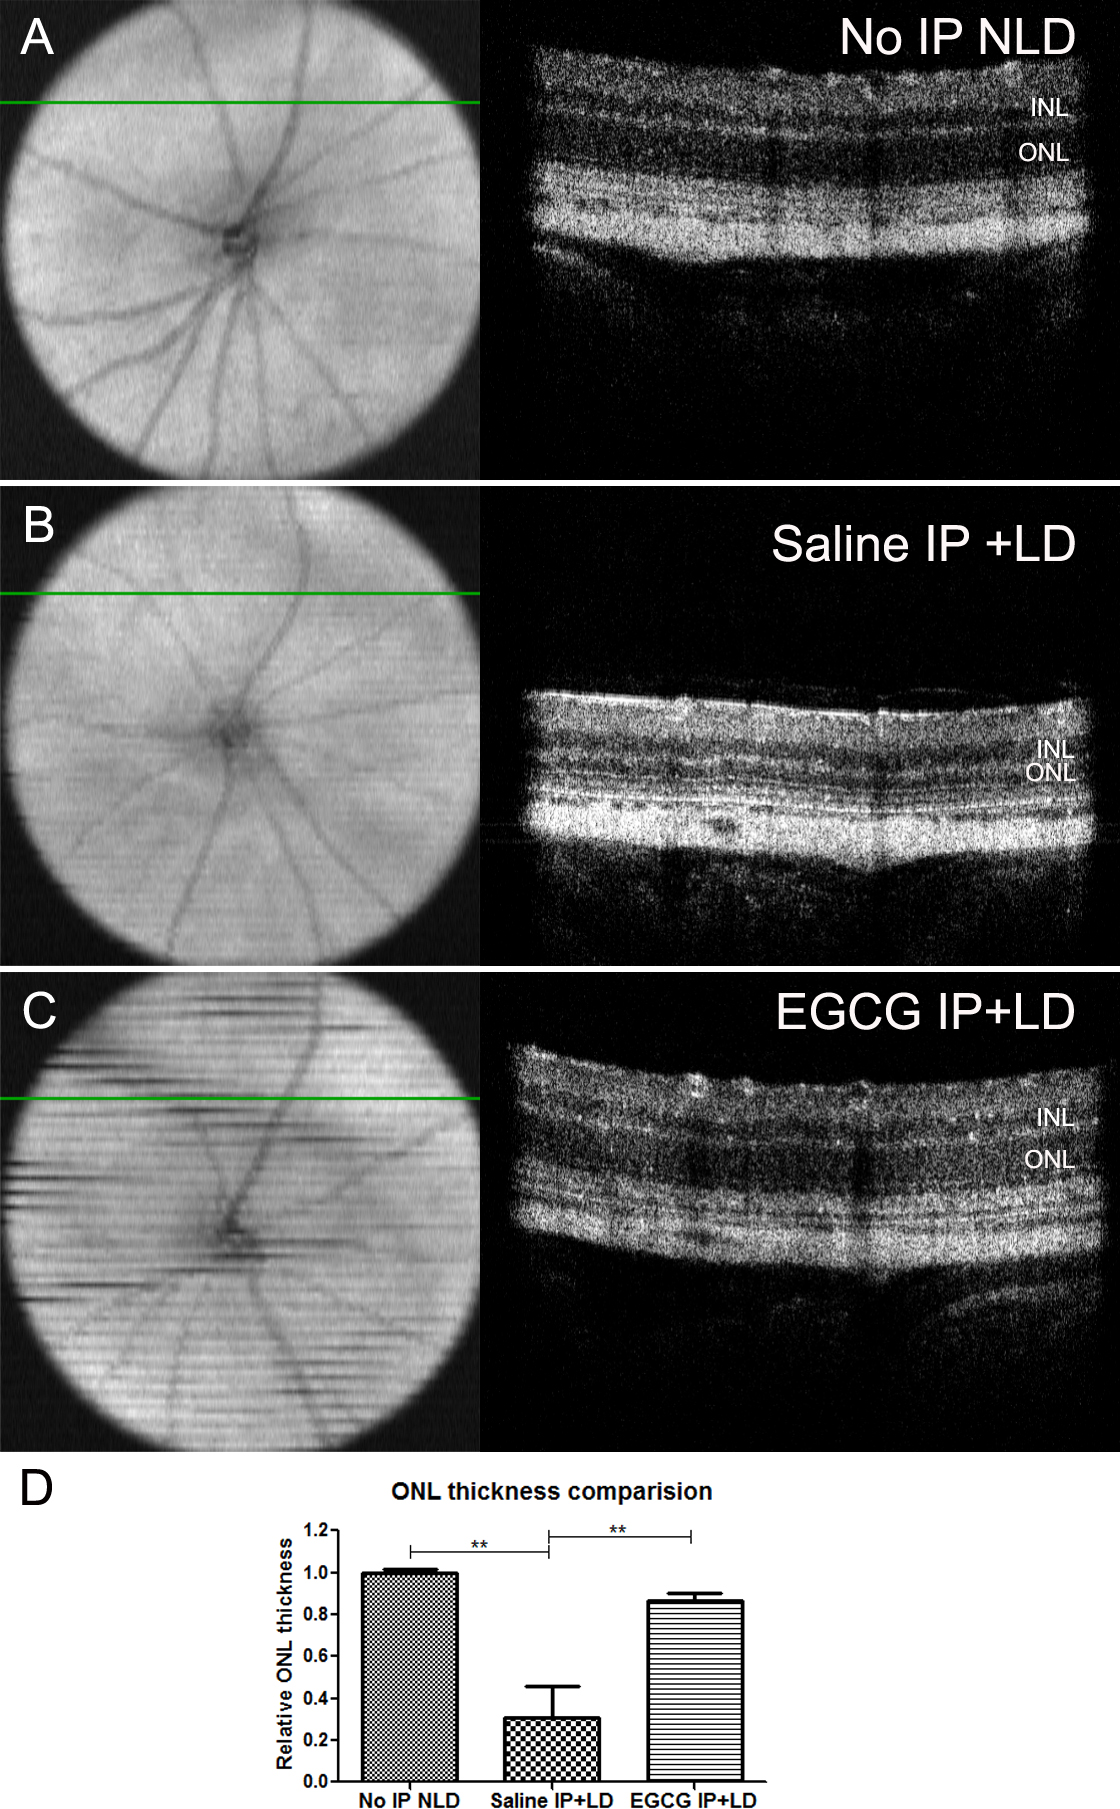
 Figure 1 of
Qi, Mol Vis 2017; 23:171-178.
Figure 1 of
Qi, Mol Vis 2017; 23:171-178.