Figure 1. F-actin distribution and fiber sizes in 3-week-old wild-type (WT) and knock-in (Ki) lenses. Images of cortical fibers from
equatorial sections stained with phalloidin for F-actin (green) and 4’,5-diamidino-2-phenylindole (DAPI) for DNA (blue). A: WT hexagonal fibers are arranged in parallel rows with F-actin enriched at their vertices. B: Ki fibers do not have the same precise organization, but F-actin is still enriched at the vertices. Compared to WT, the widths
(long axis lengths of hexagons) of Ki fibers were not uniform. Arrowheads and asterisks denote examples of short and tall
fibers, respectively. Scale bar: 10 μm. C: Plot of the average fiber cell long-side widths from images of three WT and three Ki samples. Circles denote average fiber
cell long-side width from individual samples, with error bars denoting standard deviations. Horizontal lines denote the mean
of the three sample averages. The means from WT and Ki samples were not significantly different (p>0.25). D: Histogram compiling the distribution of fiber cell widths from the three WT and Ki samples shows that Ki fibers have a much
broader distribution of widths compared to WT. Dashed lines represent Gaussian curves calculated from the mean (µ) and standard
deviation (σ) of WT and Ki fibers (µWT = 10.9 μm, σWT = 1.1 μm, μKi = 11.5 μm, σKi = 2.6 μm).
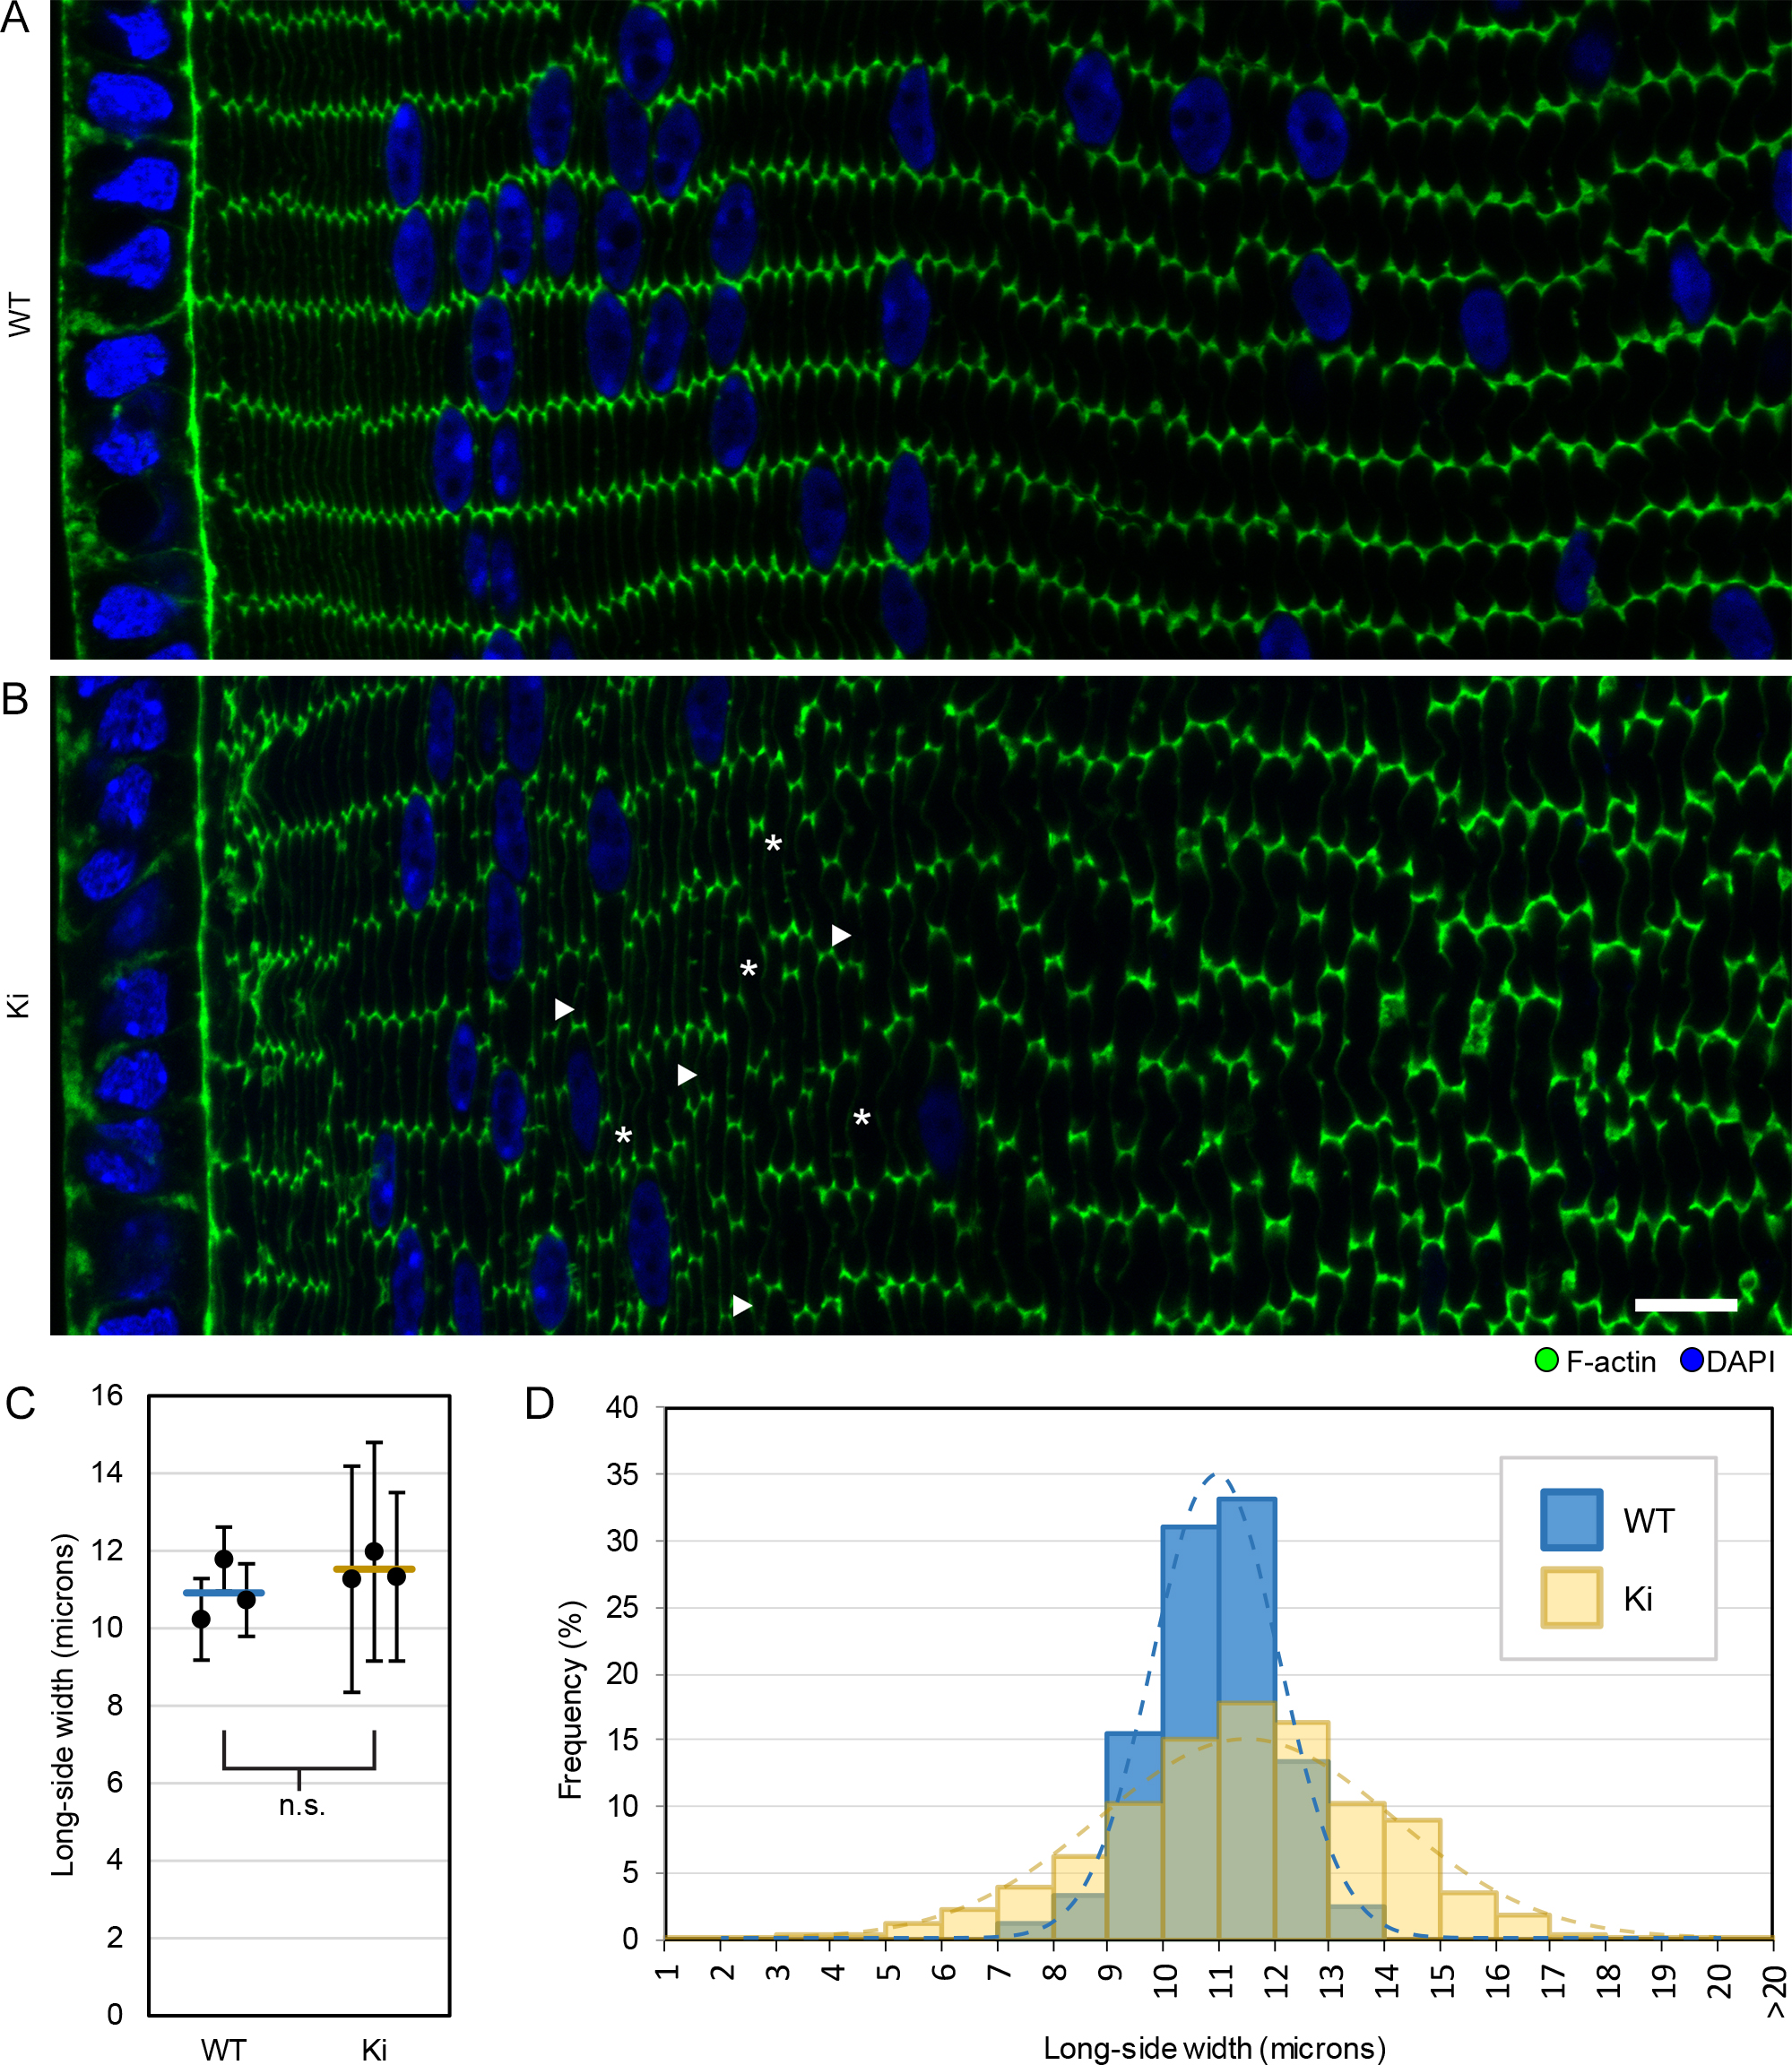
 Figure 1 of
Wang, Mol Vis 2017; 23:160-170.
Figure 1 of
Wang, Mol Vis 2017; 23:160-170.