Figure 2. Retinal vascular phenotype of Lrp5tvrm111B mice. A: Fluorescein angiographic images obtained 1, 2, 3, or 4 min following injection of sodium fluorescein from a control (top)
and a Lrp5tvrm111B (bottom) mouse. Fluorescein leakage is seen in the Lrp5tvrm111B images. B: Optical coherence tomography (OCT) cross-sections of the control (top) and Lrp5tvrm111B (bottom) retina. Arrows indicate altered profiles of capillary beds in the Lrp5tvrm111B retina. All retinal lamina are present and otherwise normal with exception to (a) the transition between inner plexiform
layer and inner nuclear layer (black arrows) which denotes the limit of penetration of the retinal vasculature (white arrows)
within the mutant, and (b) an approximately 10% reduction in overall retinal thickness between mutant and control mice. C: Color-enhanced images of capillary beds in the adult control (top) and Lrp5tvrm111B (bottom) retina. Note that the deep capillary bed, coded in blue in the control retina, is not present in the Lrp5tvrm111B retina. D: At P8, hyaloid vessel regression is advanced in the control (left) but not in the Lrp5tvrm111B retina (right). All images are representative of at least three mice.
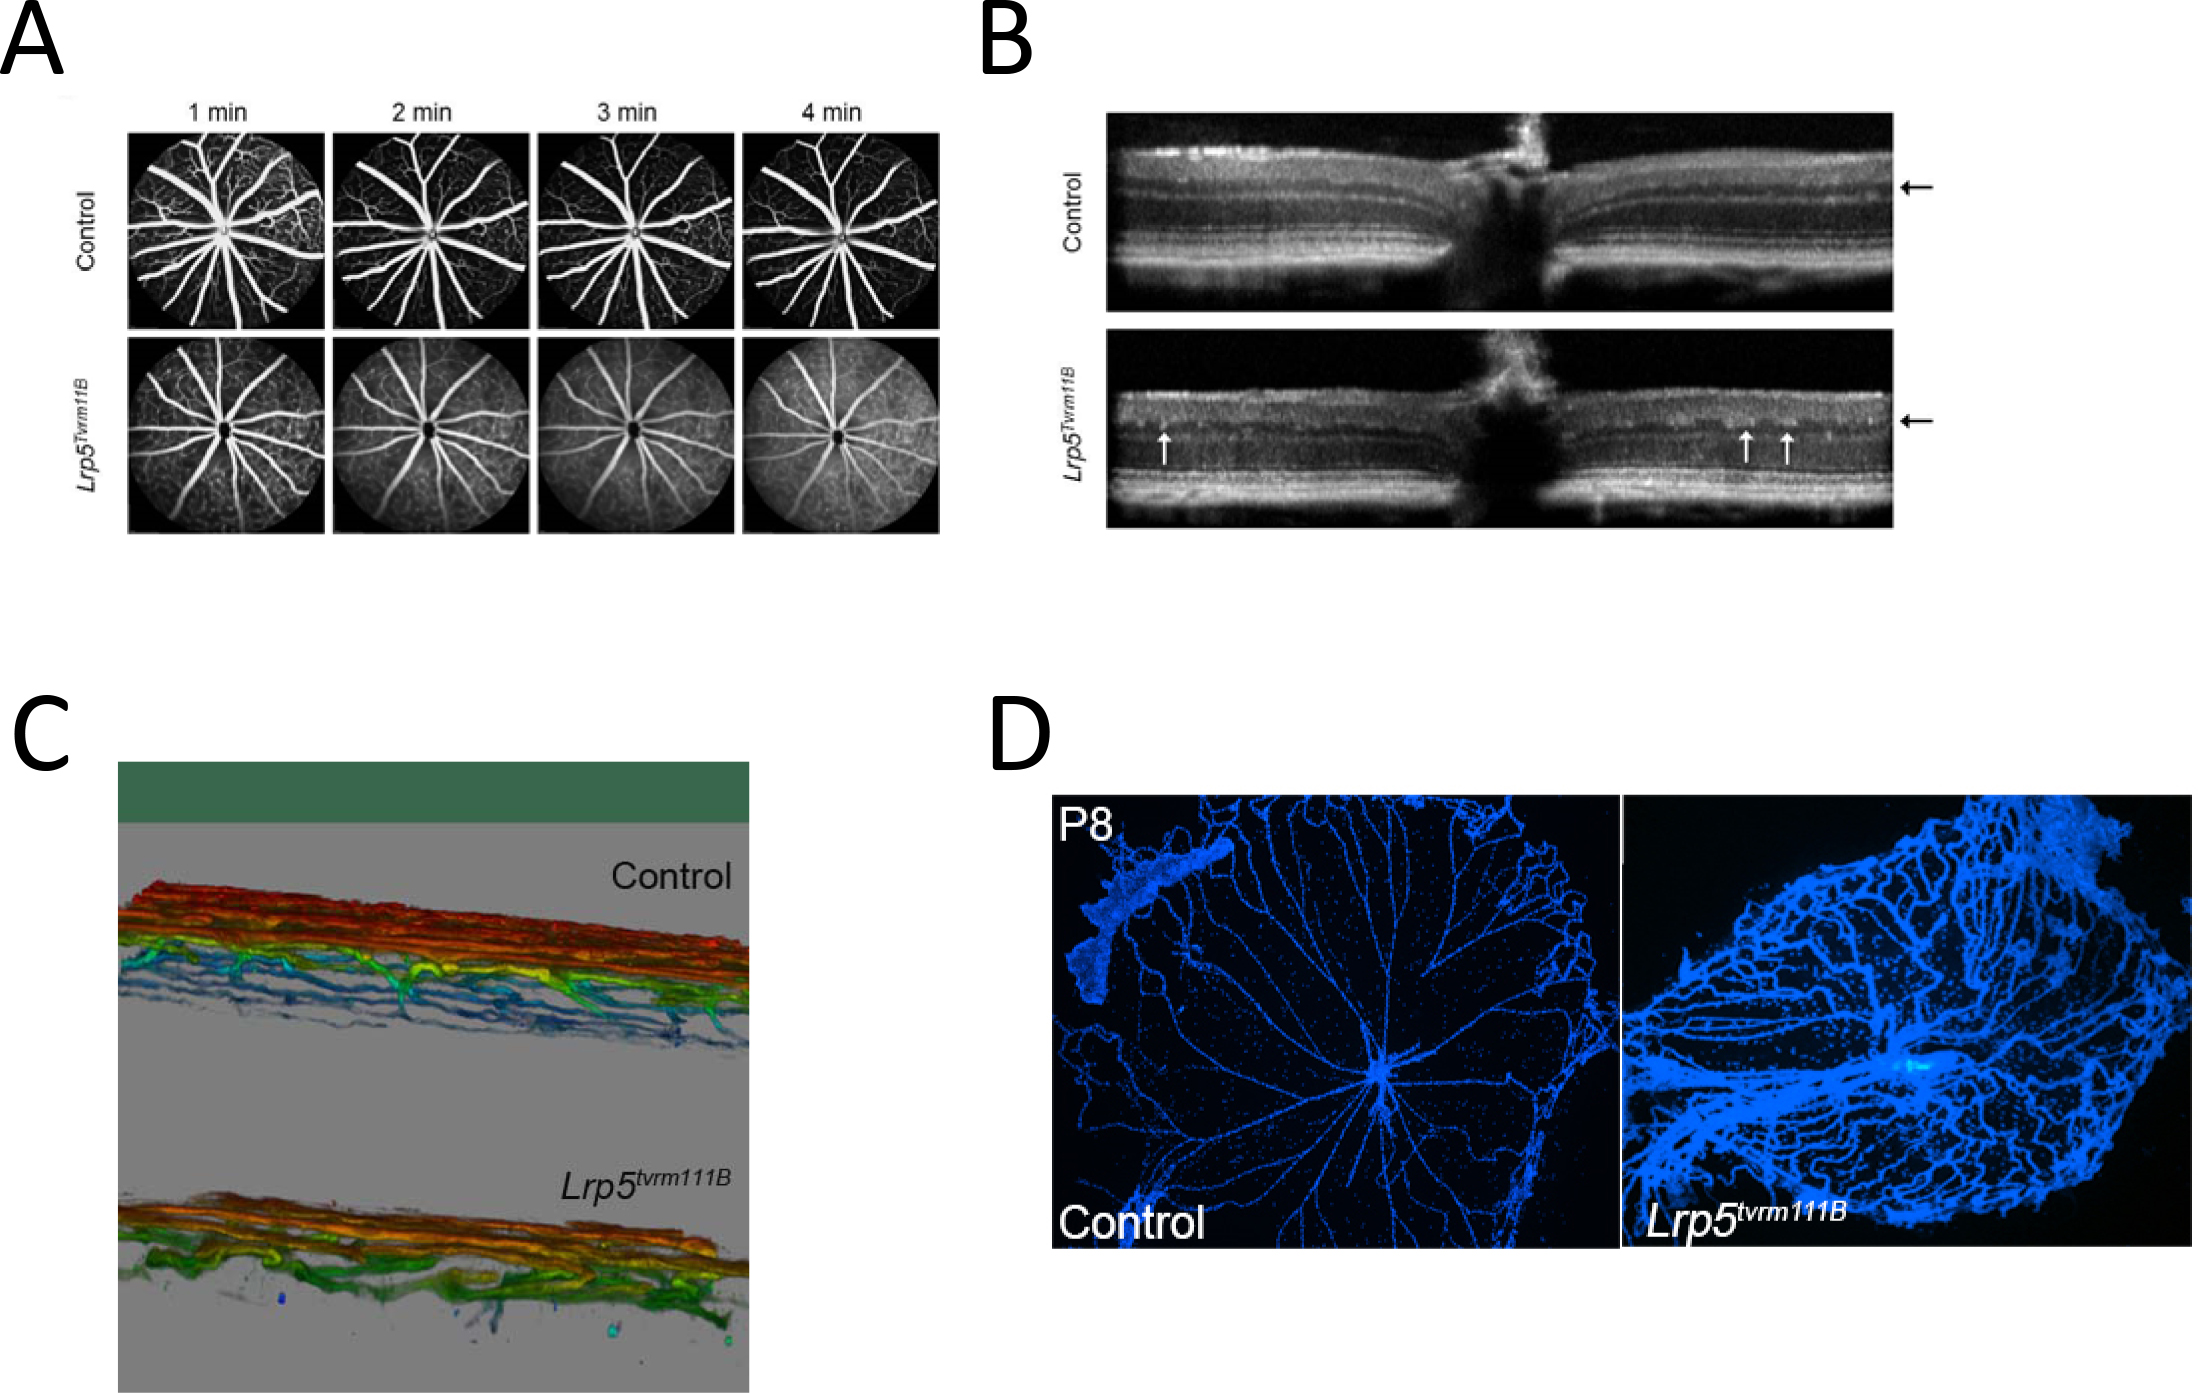
 Figure 2 of
Charette, Mol Vis 2017; 23:140-148.
Figure 2 of
Charette, Mol Vis 2017; 23:140-148.