Figure 1. Electroretinogram (ERG) phenotype of Lrp5tvrm111B mice. A: ERGs obtained from strobe flash stimuli presented to the dark-adapted eye from representative control (left) and Lrp5tvrm111B (right) littermates. Scale bars indicate 500 µV and 200 ms. B: ERGs obtained from strobe flash stimuli superimposed against a steady adapting field from representative control (left) and
Lrp5tvrm111B (right) littermates. Values to the left of each pair of waveforms indicate flash strength (log cd sec/m2). Scale bars indicate 200 µV and 200 ms.
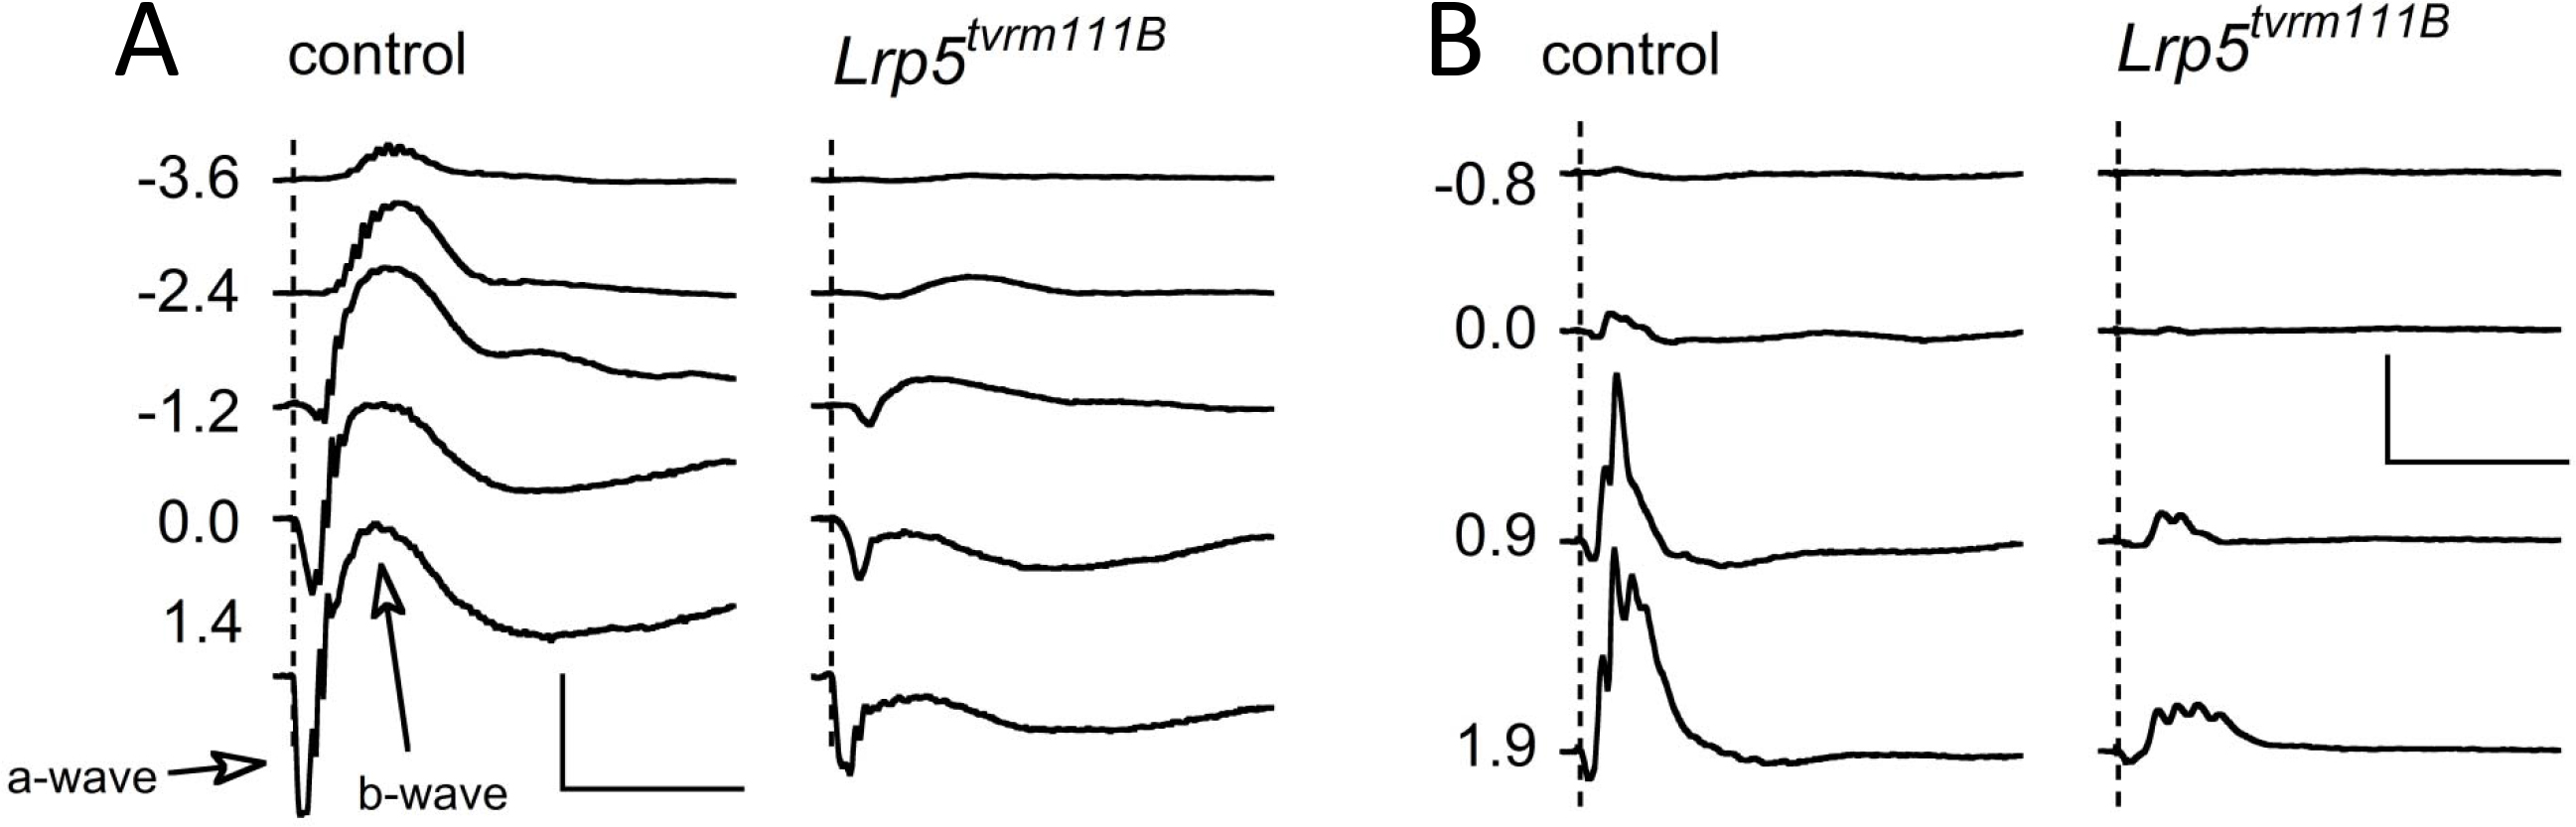
 Figure 1 of
Charette, Mol Vis 2017; 23:140-148.
Figure 1 of
Charette, Mol Vis 2017; 23:140-148.