Figure 3. Frog nocturnin promoter drives rod-specific transcription in the zebrafish retina. A: A schematic illustrates the configuration of the transgene cassette to express green fluorescent protein (GFP) in the zebrafish
under the control of the frog nocturnin promoter, which covers 398 bp upstream of and 21 bp downstream of the translation start site of the nocturnin gene. This construct, thus, drives the expression of a fusion protein between GFP and the first seven amino acids of frog
nocturnin. SV40 polyA stands for the 3′- untranslated region (UTR) of the SV40 gene and its polyadenylation signals. The transgene is flanked by two Tol2 transposon elements (Tol2). The diagram is not drawn
to scale. A double-headed arrow indicates the region that was amplified when the fish was PCR genotyped. B–E: In Tg(nocturninfrog:GFP) pt158, GFP immunostaining highlighted rods. GFP was enriched in the rod cell nuclei in the basal half of the outer nuclear layer
(green; arrows). Double arrows indicate the GFP signals in the rod spherules. In contrast, no GFP expression was detected
in the UV cone nuclei (arrowhead) and the RGB cones (red, green, and blue cones). The cell nuclei were stained with TO-PRO
(red). Panel E is a magnification of the boxed region in panel D. F-I: In Tg(nocturninfrog:GFP) pt158, GFP localized to cells positive for the rod marker Zpr3 at the outer segments (arrows). Panel I is a magnification of the boxed region in panel H. J–M: In Tg(nocturninfrog:GFP) pt158, GFP signals did not colocalize with double cone marker Zpr1. Panel M is a magnification of the boxed region in panel L. Arrowheads indicate the double cone pedicle synaptic junctions, and arrows indicate the rod spherules. The GFP signals at
the outer segments were stronger when GFP was visualized directly with its own florescence (panels F and J) than indirectly with immunostaining (panel B). This difference is believed to be due to the strong autofluorescence of the
visual pigments at the outer segments: When GFP expression was as weak as in Tg(nocturninfrog:GFP) pt158, to directly visualize GFP expression with its own florescence under confocal microscopy, we needed to use a much stronger
laser power, which made the autofluorescence of the visual pigments more prominent. Thus, the GFP expression patterns in Tg(nocturninfrog:GFP) pt158 could be more reliably determined by its presence in the synaptic junctions, cell body, and inner segments. N: Western blotting showed that even after a 1,000-fold dilution with wild-type eye extracts, the GFP level in the Tg(−3.7rho:EGFP)kj2 transgenic fish eye was still significantly higher than that in Tg(nocturninfrog:GFP) pt158 (compare lane 6 with lane 4). α-tubulin blotting served as a loading control. O: A histogram of the intensity ratio between Tg(nocturninfrog:GFP) pt158 GFP and α-tubulin signals (N) normalized against the ratio at 8 AM, shows no apparent rhythmic fluctuation in GFP levels among the four time points. Scale
bars, 20 μm.
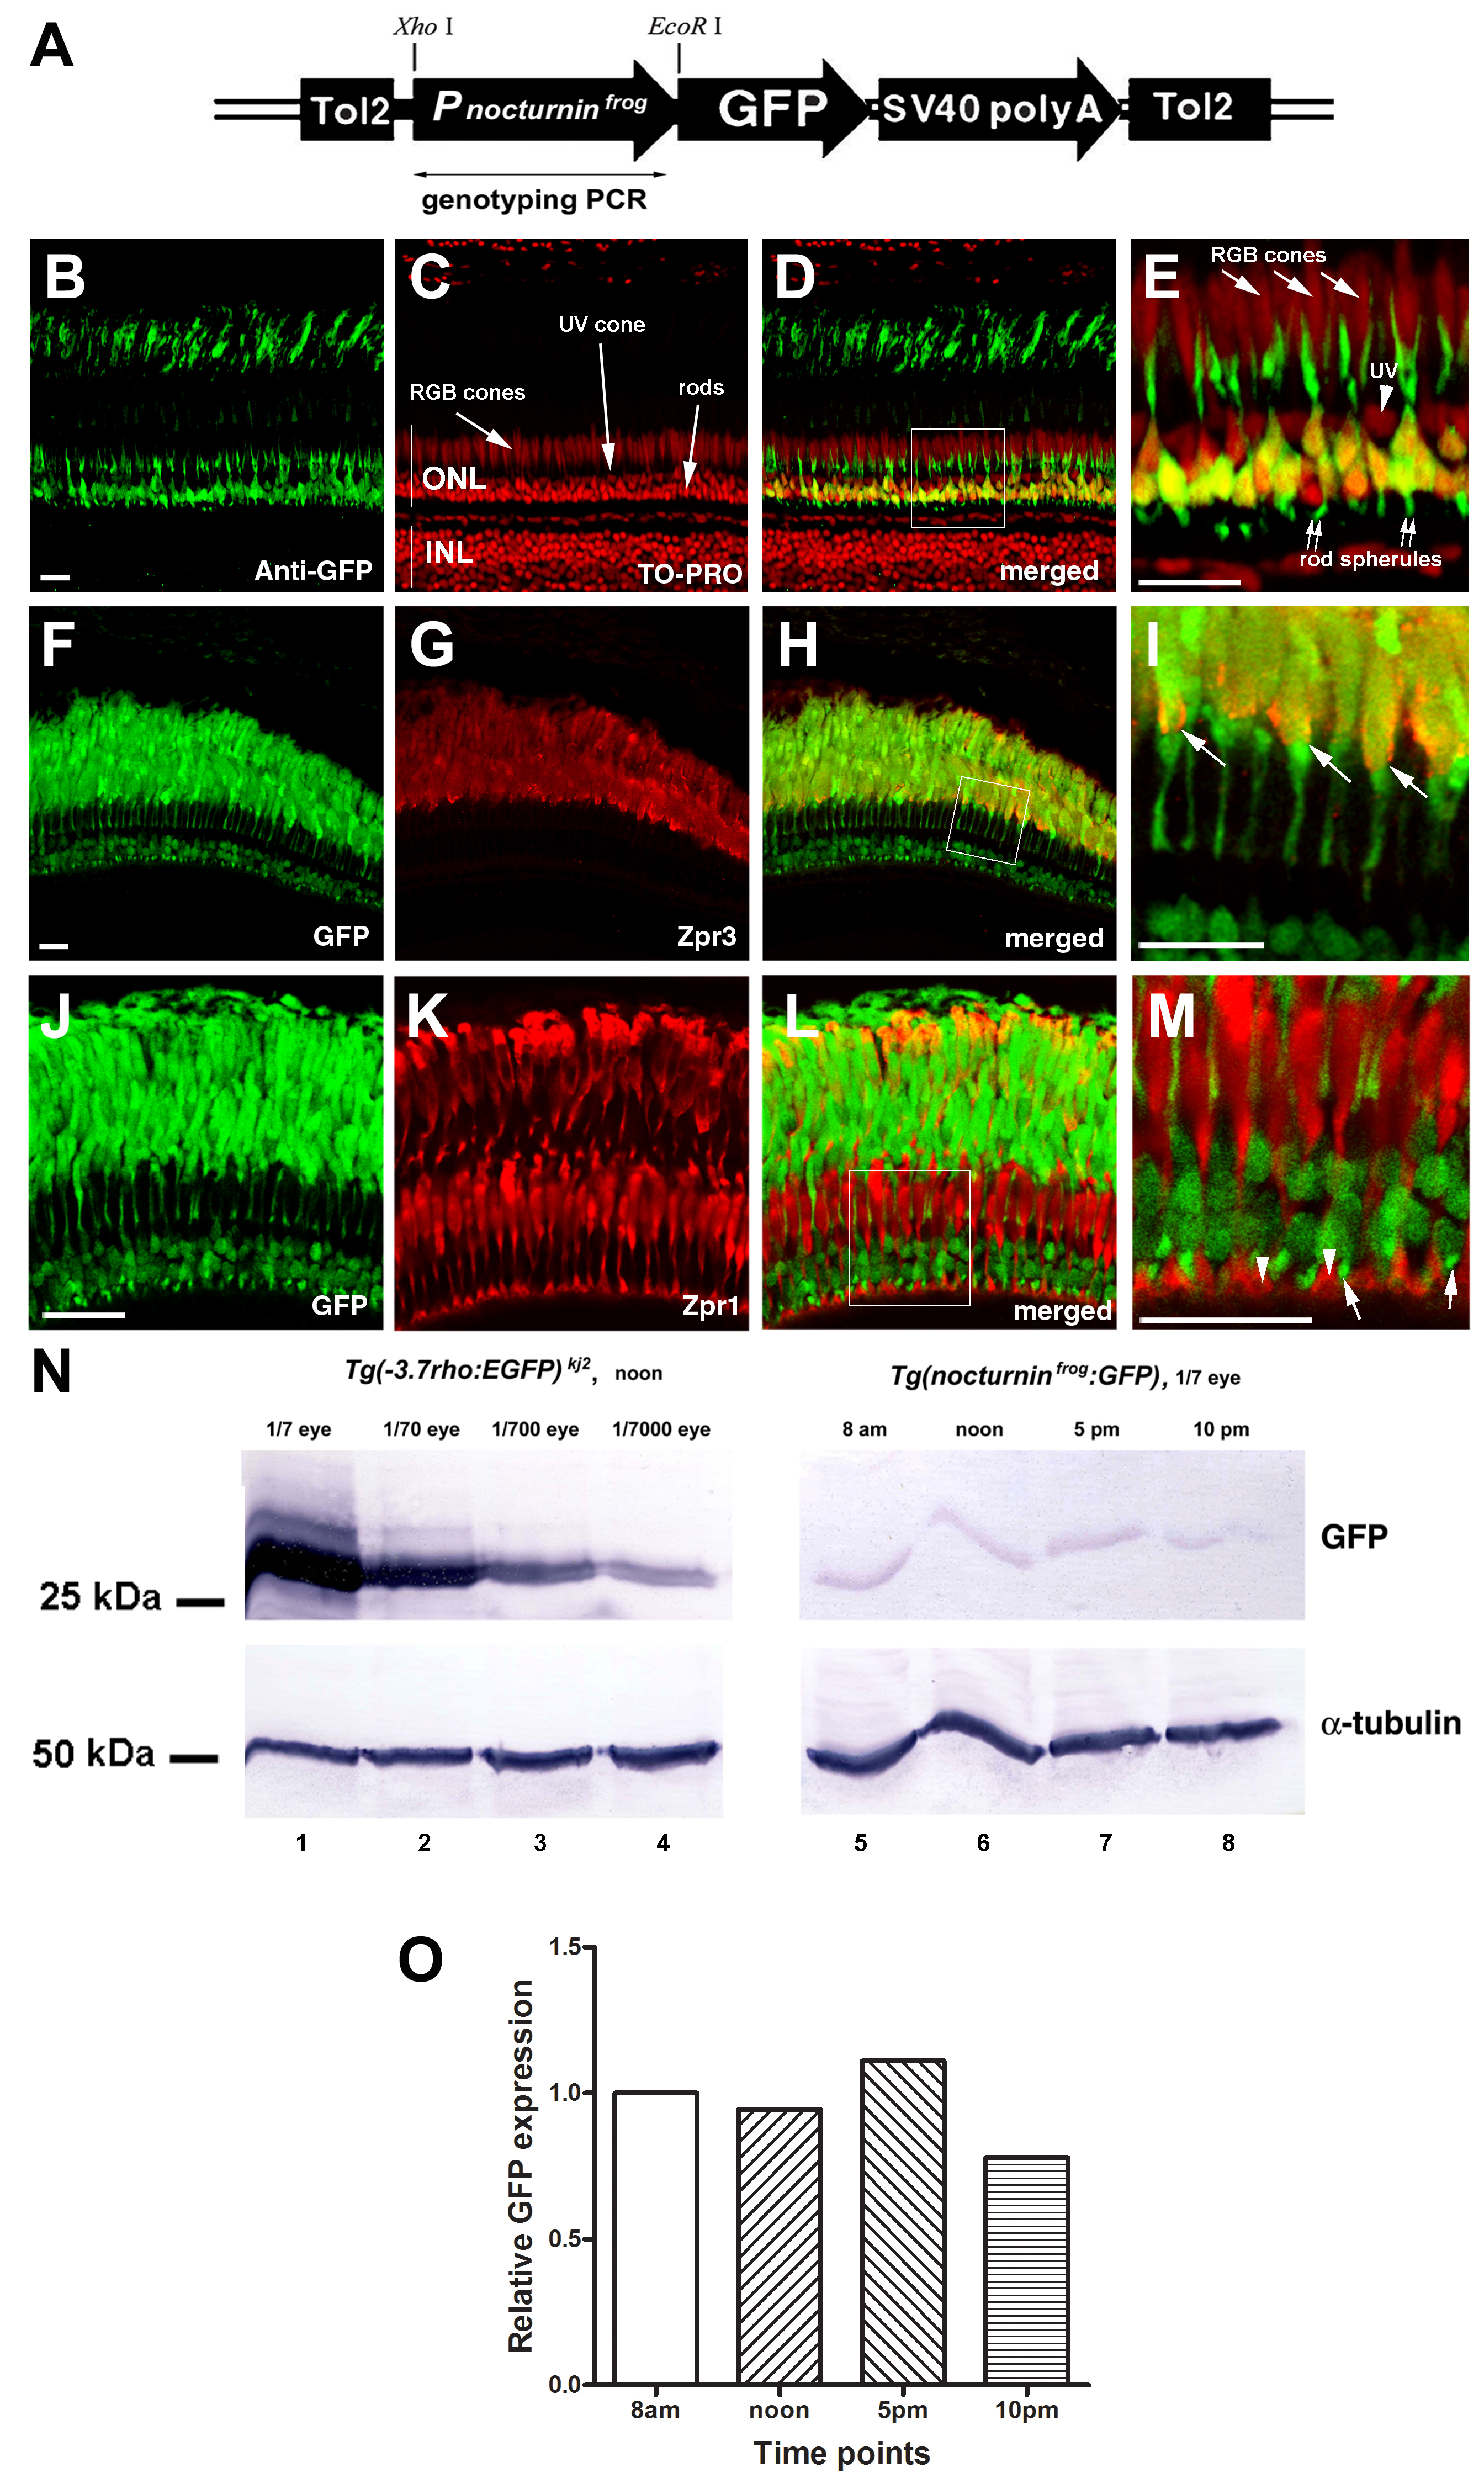
 Figure 3 of
Yang, Mol Vis 2017; 23:1039-1047.
Figure 3 of
Yang, Mol Vis 2017; 23:1039-1047.