Figure 6. Low physiologic oxygen conditions change slightly the transcriptome of choroidal melanocytes. A: Scatterplots of signal intensity in log2 from 60,000 different targets covering the entire human transcriptome of choroidal melanocytes (n = 3) exposed to hyperoxia
(the y-axis) plotted against their counterpart grown under low physiologic oxygen conditions (the x-axis). The twofold change
in intensity lines is shown in green. The displacement of the linear regression curve (dashed purple) away from the central
axis reflects the degree of divergence in the pattern of gene expression between the two oxygen conditions (R2 value, coefficient of determination). B: Heatmap representation of mRNAs containing a hypoxia-response element expressed by choroidal melanocytes expanded at 21%
or 3% O2. C: Heatmap representation of mRNAs linked to melanocyte differentiation expressed by choroidal melanocytes expanded at 21%
or 3% O2. Data are also presented for the housekeeping mRNA golgin A1 (GOLGA1), C-terminal binding protein 1 (CTBP1), and beta-2-microglobulin
(B2M). Transcripts indicated in dark blue correspond to those whose expression is low, whereas highly expressed transcripts
are shown in orange and red.
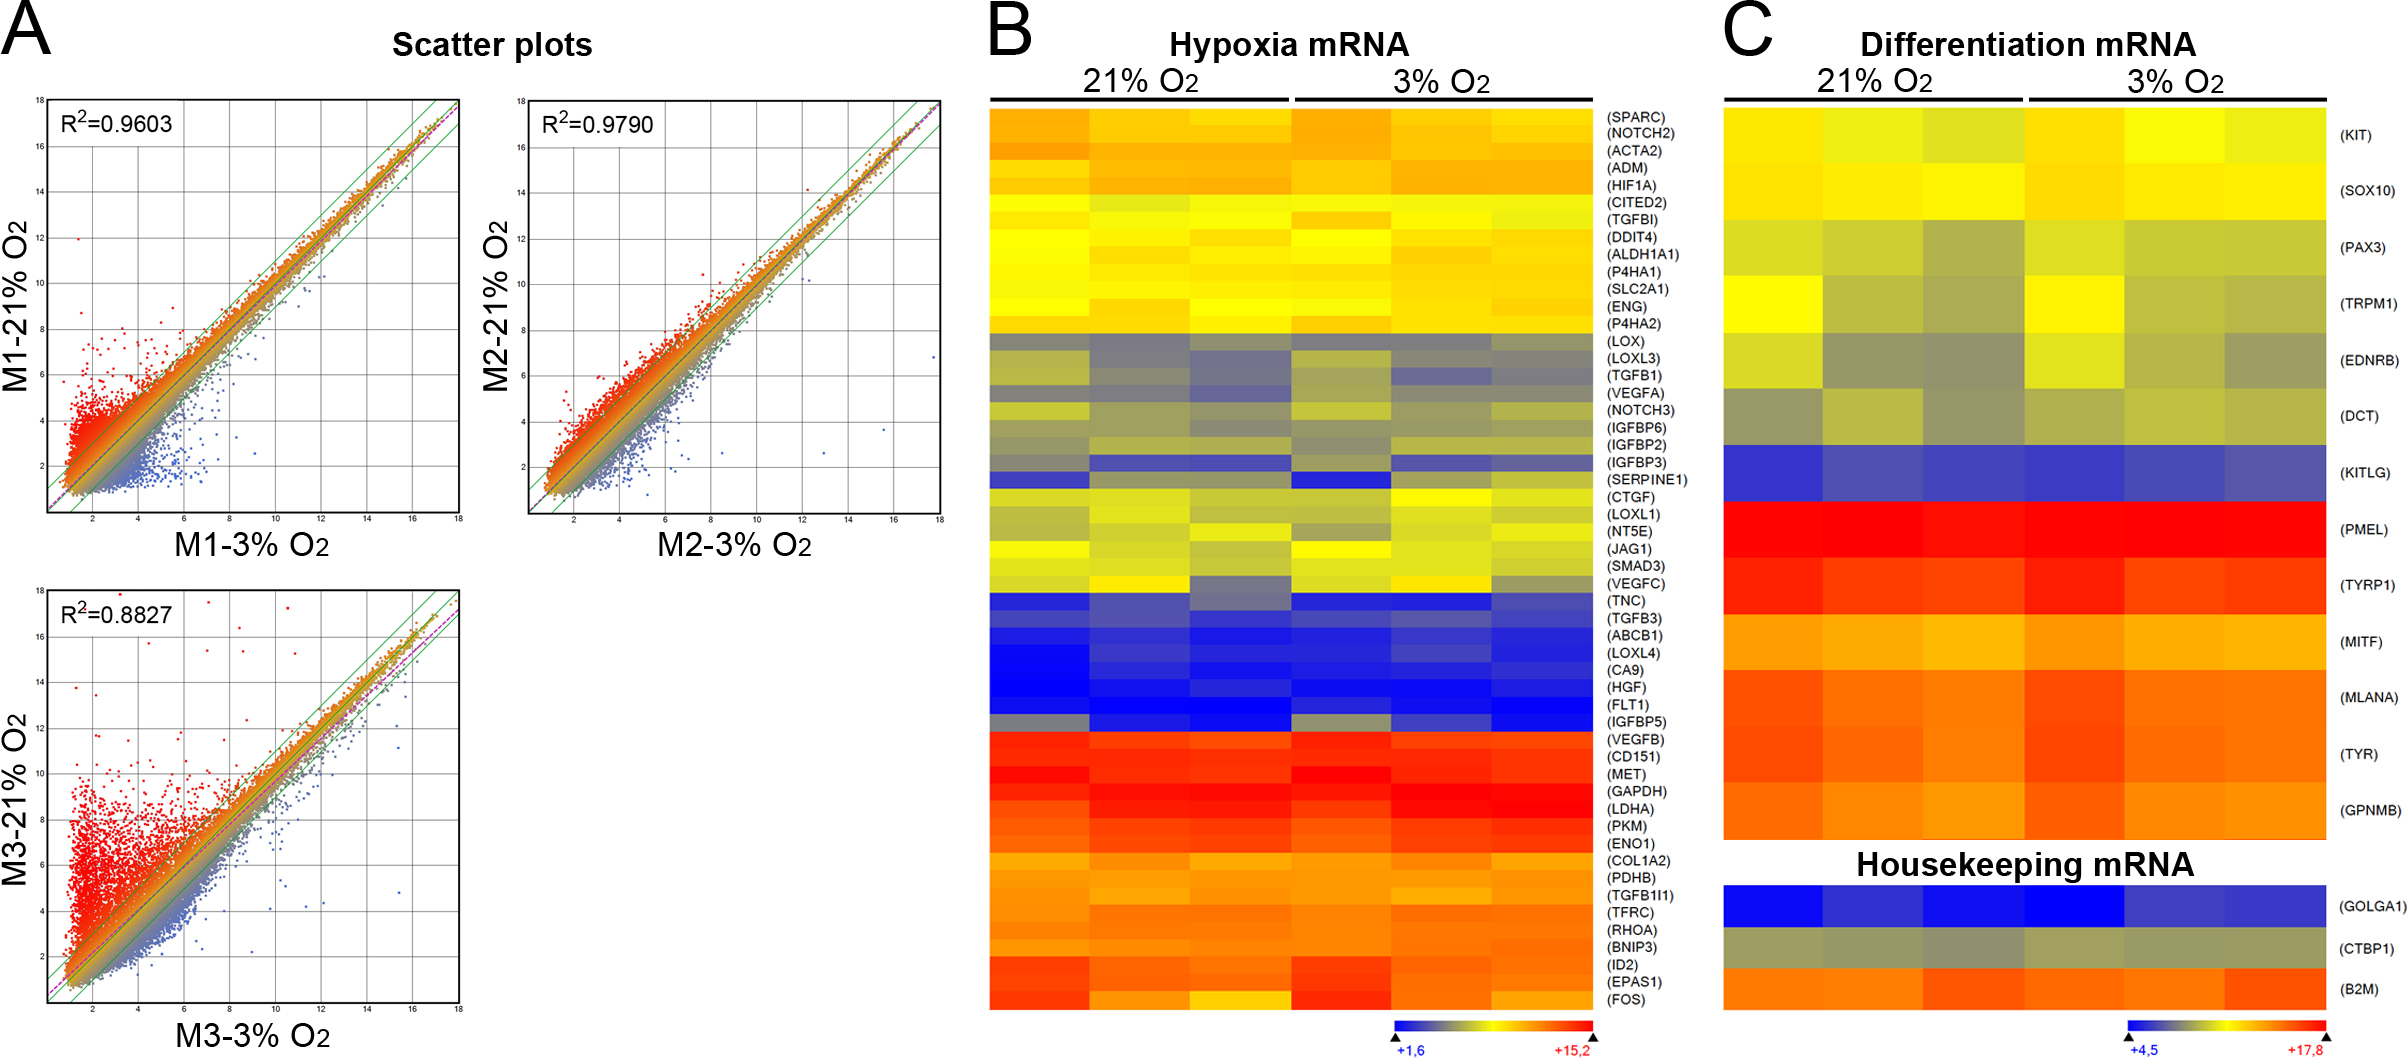
 Figure 6 of
Weidmann, Mol Vis 2017; 23:103-115.
Figure 6 of
Weidmann, Mol Vis 2017; 23:103-115.