Figure 1. Epac1 agonist decreased TNF-α and IL-1β in vitro. Data show results from retinal endothelial cells (RECs) grown in normal
glucose (NG) or high glucose (HG) only, grown in NG or HG and treated with CPT-2’-O-Me-cAMP, an exchange protein for cAMP
1 (Epac1)-specific agonist (NG or HG+8CPT-cAMP), and grown in NG and HG and treated with scrambled (NG or HG+Sc) or Epac1
siRNA (NG or HG+Epac1 siRNA). A: Western blot data show successful knockdown of Epac1. B: Western blot data for Epac2 show that CPT-2’-O-Me-cAMP is specific for Epac1. C: Enzyme-linked immunosorbent assay (ELISA) data for tumor necrosis factor alpha (TNF-α). D: Data for interleukin-1β (IL-1β). E: Western blot results for nuclear factor kappa beta (NFκB). F: Western blot results for inhibitor of kappa beta (IκB). n = 4 for each group. Data are mean ± standard error of the mean
(SEM). * p<0.05 versus NG, #p<0.05 versus HG, $p<0.05 versus HG+8CPT-cAMP.
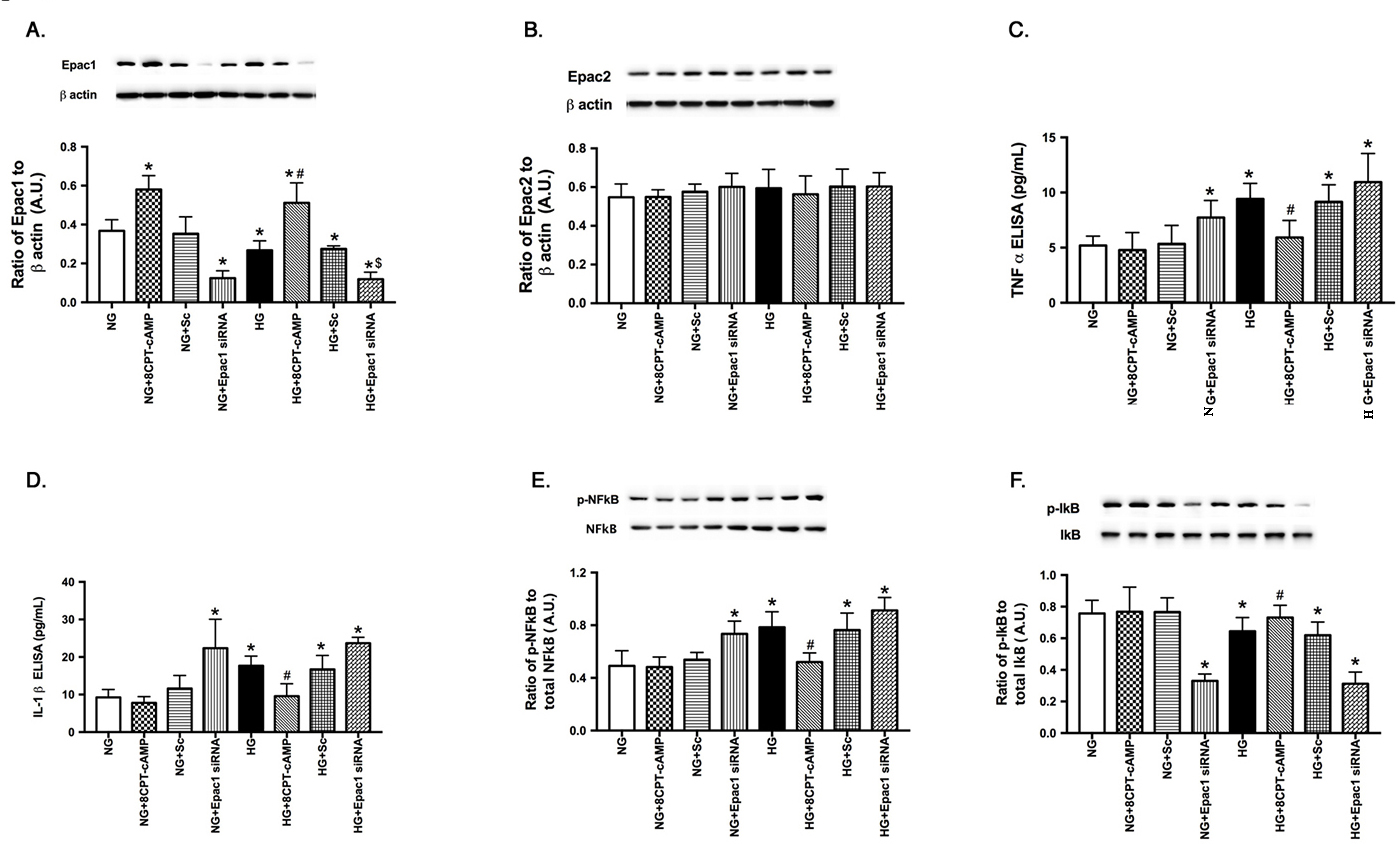
 Figure 1 of
Liu, Mol Vis 2017; 23:1-7.
Figure 1 of
Liu, Mol Vis 2017; 23:1-7.