Figure 3. Alteration of the dopaminergic system in diabetic mice at 12 weeks post-diabetes. A: Right panel: representative flatmounted retinas from a control and a streptozotocin (STZ)-diabetic animal, immunostained
with tyrosine hydroxylase (TH) antibody. Scale bar = 40 µm. Left panel: total number of TH-positive cells in the control and
diabetic mice at 12 weeks post-diabetes. A significant reduction in the total number of TH-positive cells was observed in
the diabetic group in comparison to the age-matched control animals. Data are represented as mean ± standard error of the
mean (SEM; n = 6 for the control group and n = 5 for the diabetic mice group). B: Dopamine (DA) and 3,4-dihydroxyphenylacetic acid (DOPAC) levels, and the DOPAC/DA ratio in wild-type and diabetic mice at
12 weeks post-diabetes and at two different Zeitgeber time (ZT) points (ZT2 and ZT14; n = 7 for control and n = 8 for diabetic
mice for each ZT point). The post-hoc Newman-Keuls test shows a significant difference in the DA level at ZT2 between the
control and diabetic groups, whereas no significant difference was observed at ZT14. The DOPAC content and the DOPAC/DA ratio
are similar between the two groups at the two ZTs. Data are represented as mean ± SEM, * p≤0.05.
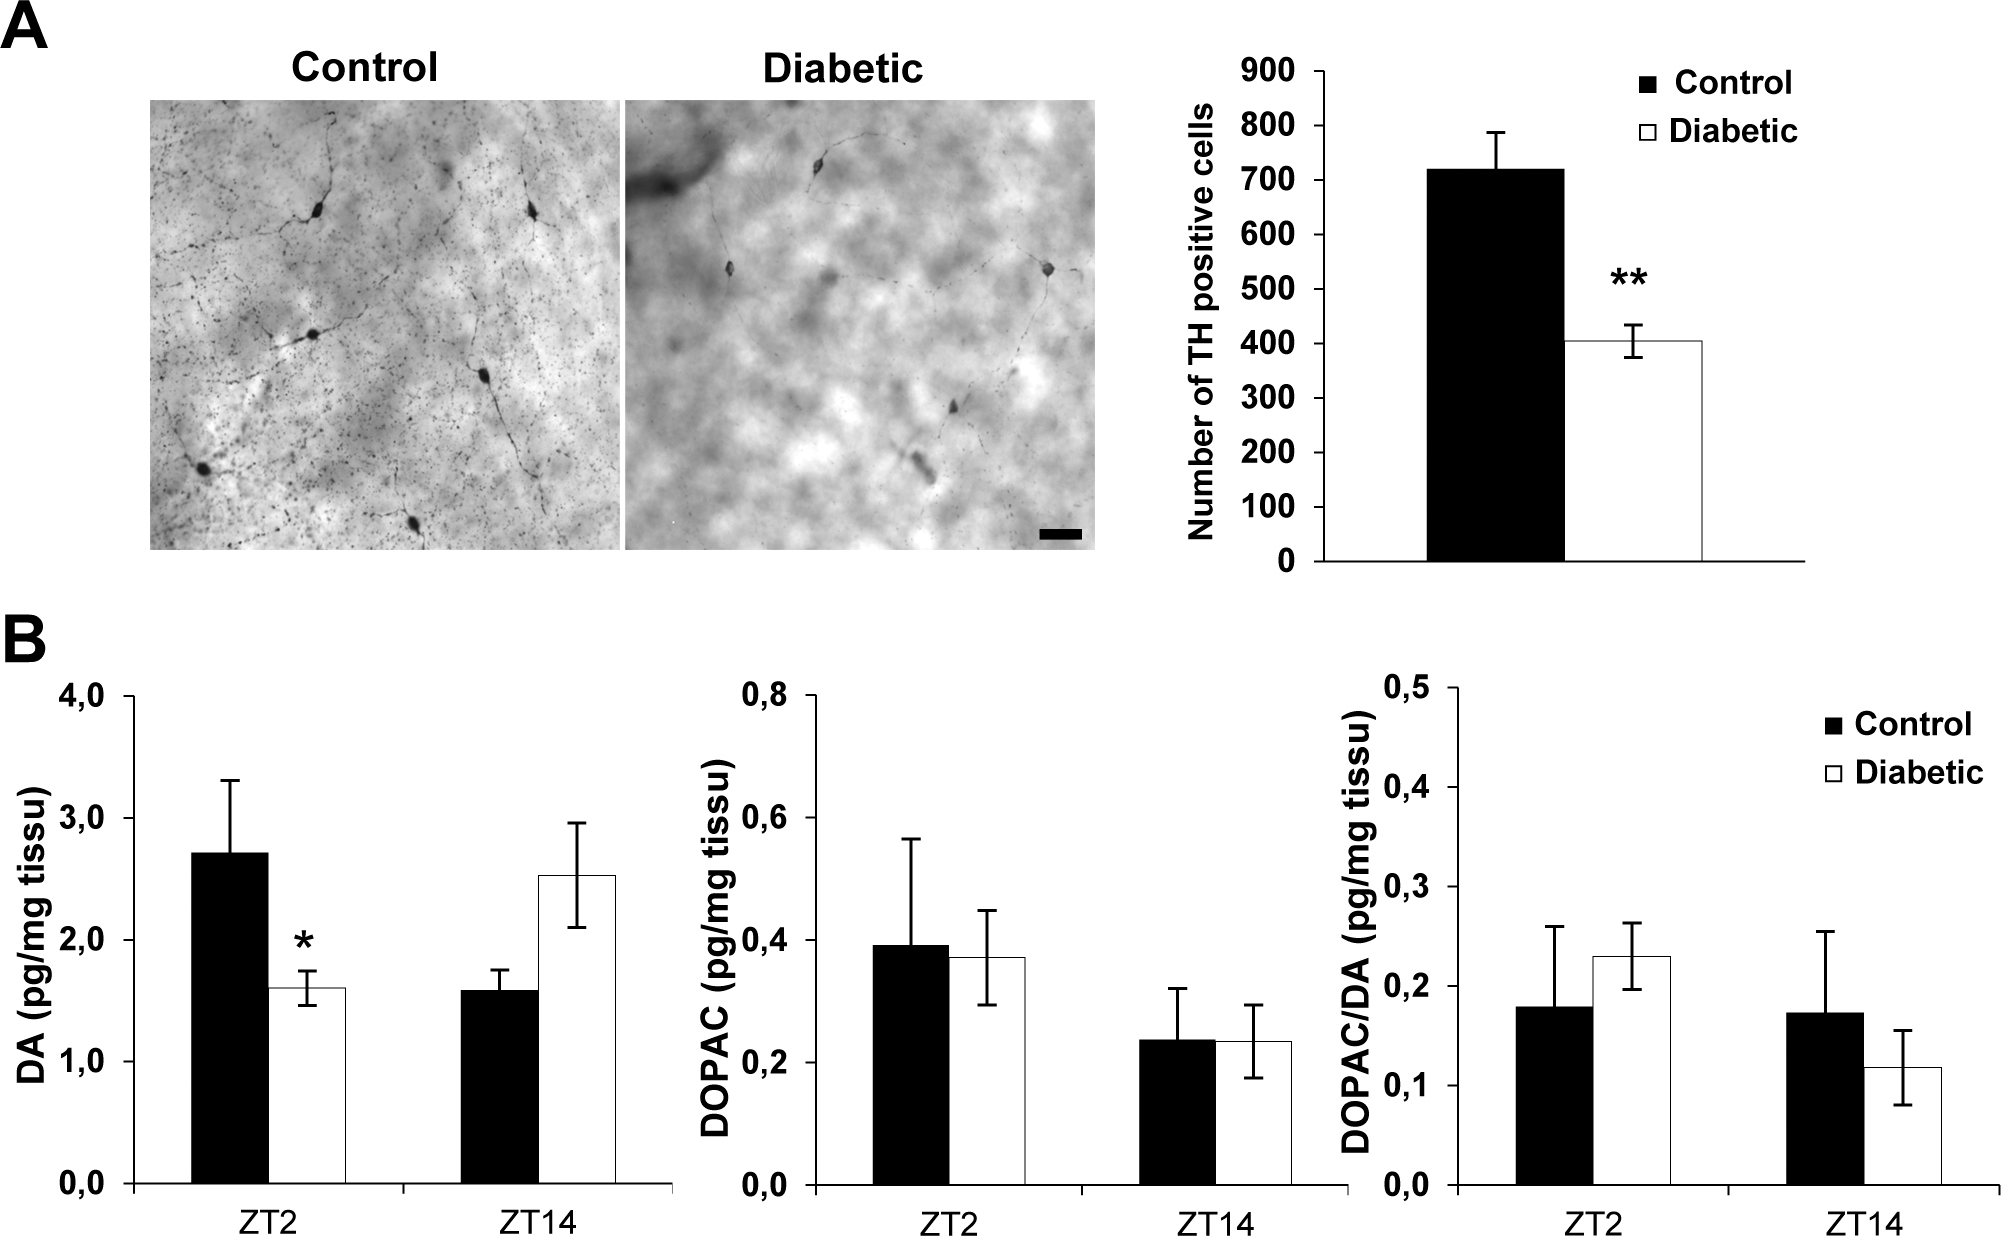
 Figure 3 of
Lahouaoui, Mol Vis 2016; 22:959-969.
Figure 3 of
Lahouaoui, Mol Vis 2016; 22:959-969.