Figure 2. Relative light-induced c-fos, Per1 and Per2 mRNA levels in the retinas of the control and diabetic mice at 12 weeks post-diabetes. The light stimulus is a 480 nm monochromatic
light pulse (1.17× 10¹⁴ photons/cm2/s, 15 min duration) delivered at circadian time 16 (CT16). White bars represent animals that received the light pulse (L,
n = 7 for each group). The dark control mice (D, black bars) were handled in the same way but did not received a light stimulus
(n = 4–5 for each group). Data are represented as mean ± standard error of the mean (SEM). Asterisk indicates a statistically
significant difference (* p≤0.05; ** p≤0.01; *** p≤0.001).
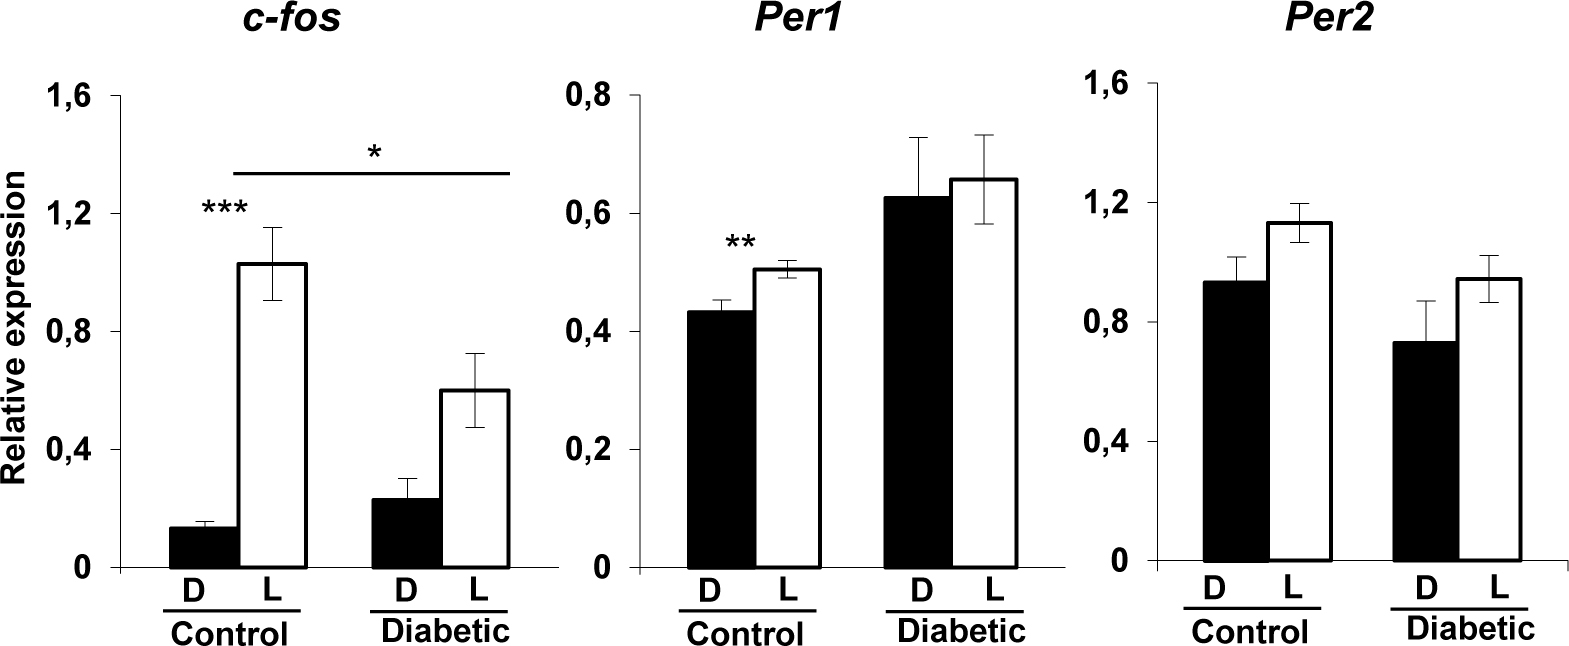
 Figure 2 of
Lahouaoui, Mol Vis 2016; 22:959-969.
Figure 2 of
Lahouaoui, Mol Vis 2016; 22:959-969.