Figure 1. Circadian expression of clock genes (Per1–3, Bmal1, Clock, Cry1–2, Rev-erbα, and Rorβ) and clock-controlled genes (Dbp and E4BP4) in the retina and the SCN of the wild-type and STZ-diabetic mice at 12 weeks post-diabetes. Animals were euthanized in constant
darkness (DD). Pooled retinas (n = 4 for each circadian time (CT) and each group) and individual suprachiasmatic nucleus (SCN;
n = 4 for each CT and each group) from the same animals were isolated every 4 h (CT0, CT4, CT8, CT12, CT16, and CT20), and
mRNA levels were measured using real-time reverse transcription PCR (RT–PCR). Results are expressed as mean ± standard error
of the mean (SEM). Data from CT0 are double plotted at CT24. Continuous (wild-type) and dashed (diabetic) lines represent
the periodic sinusoidal function determined by Cosinor analysis. Only periodic sinusoidal functions with amplitude significantly
different from zero are represented (p≤0.05, zero amplitude test).
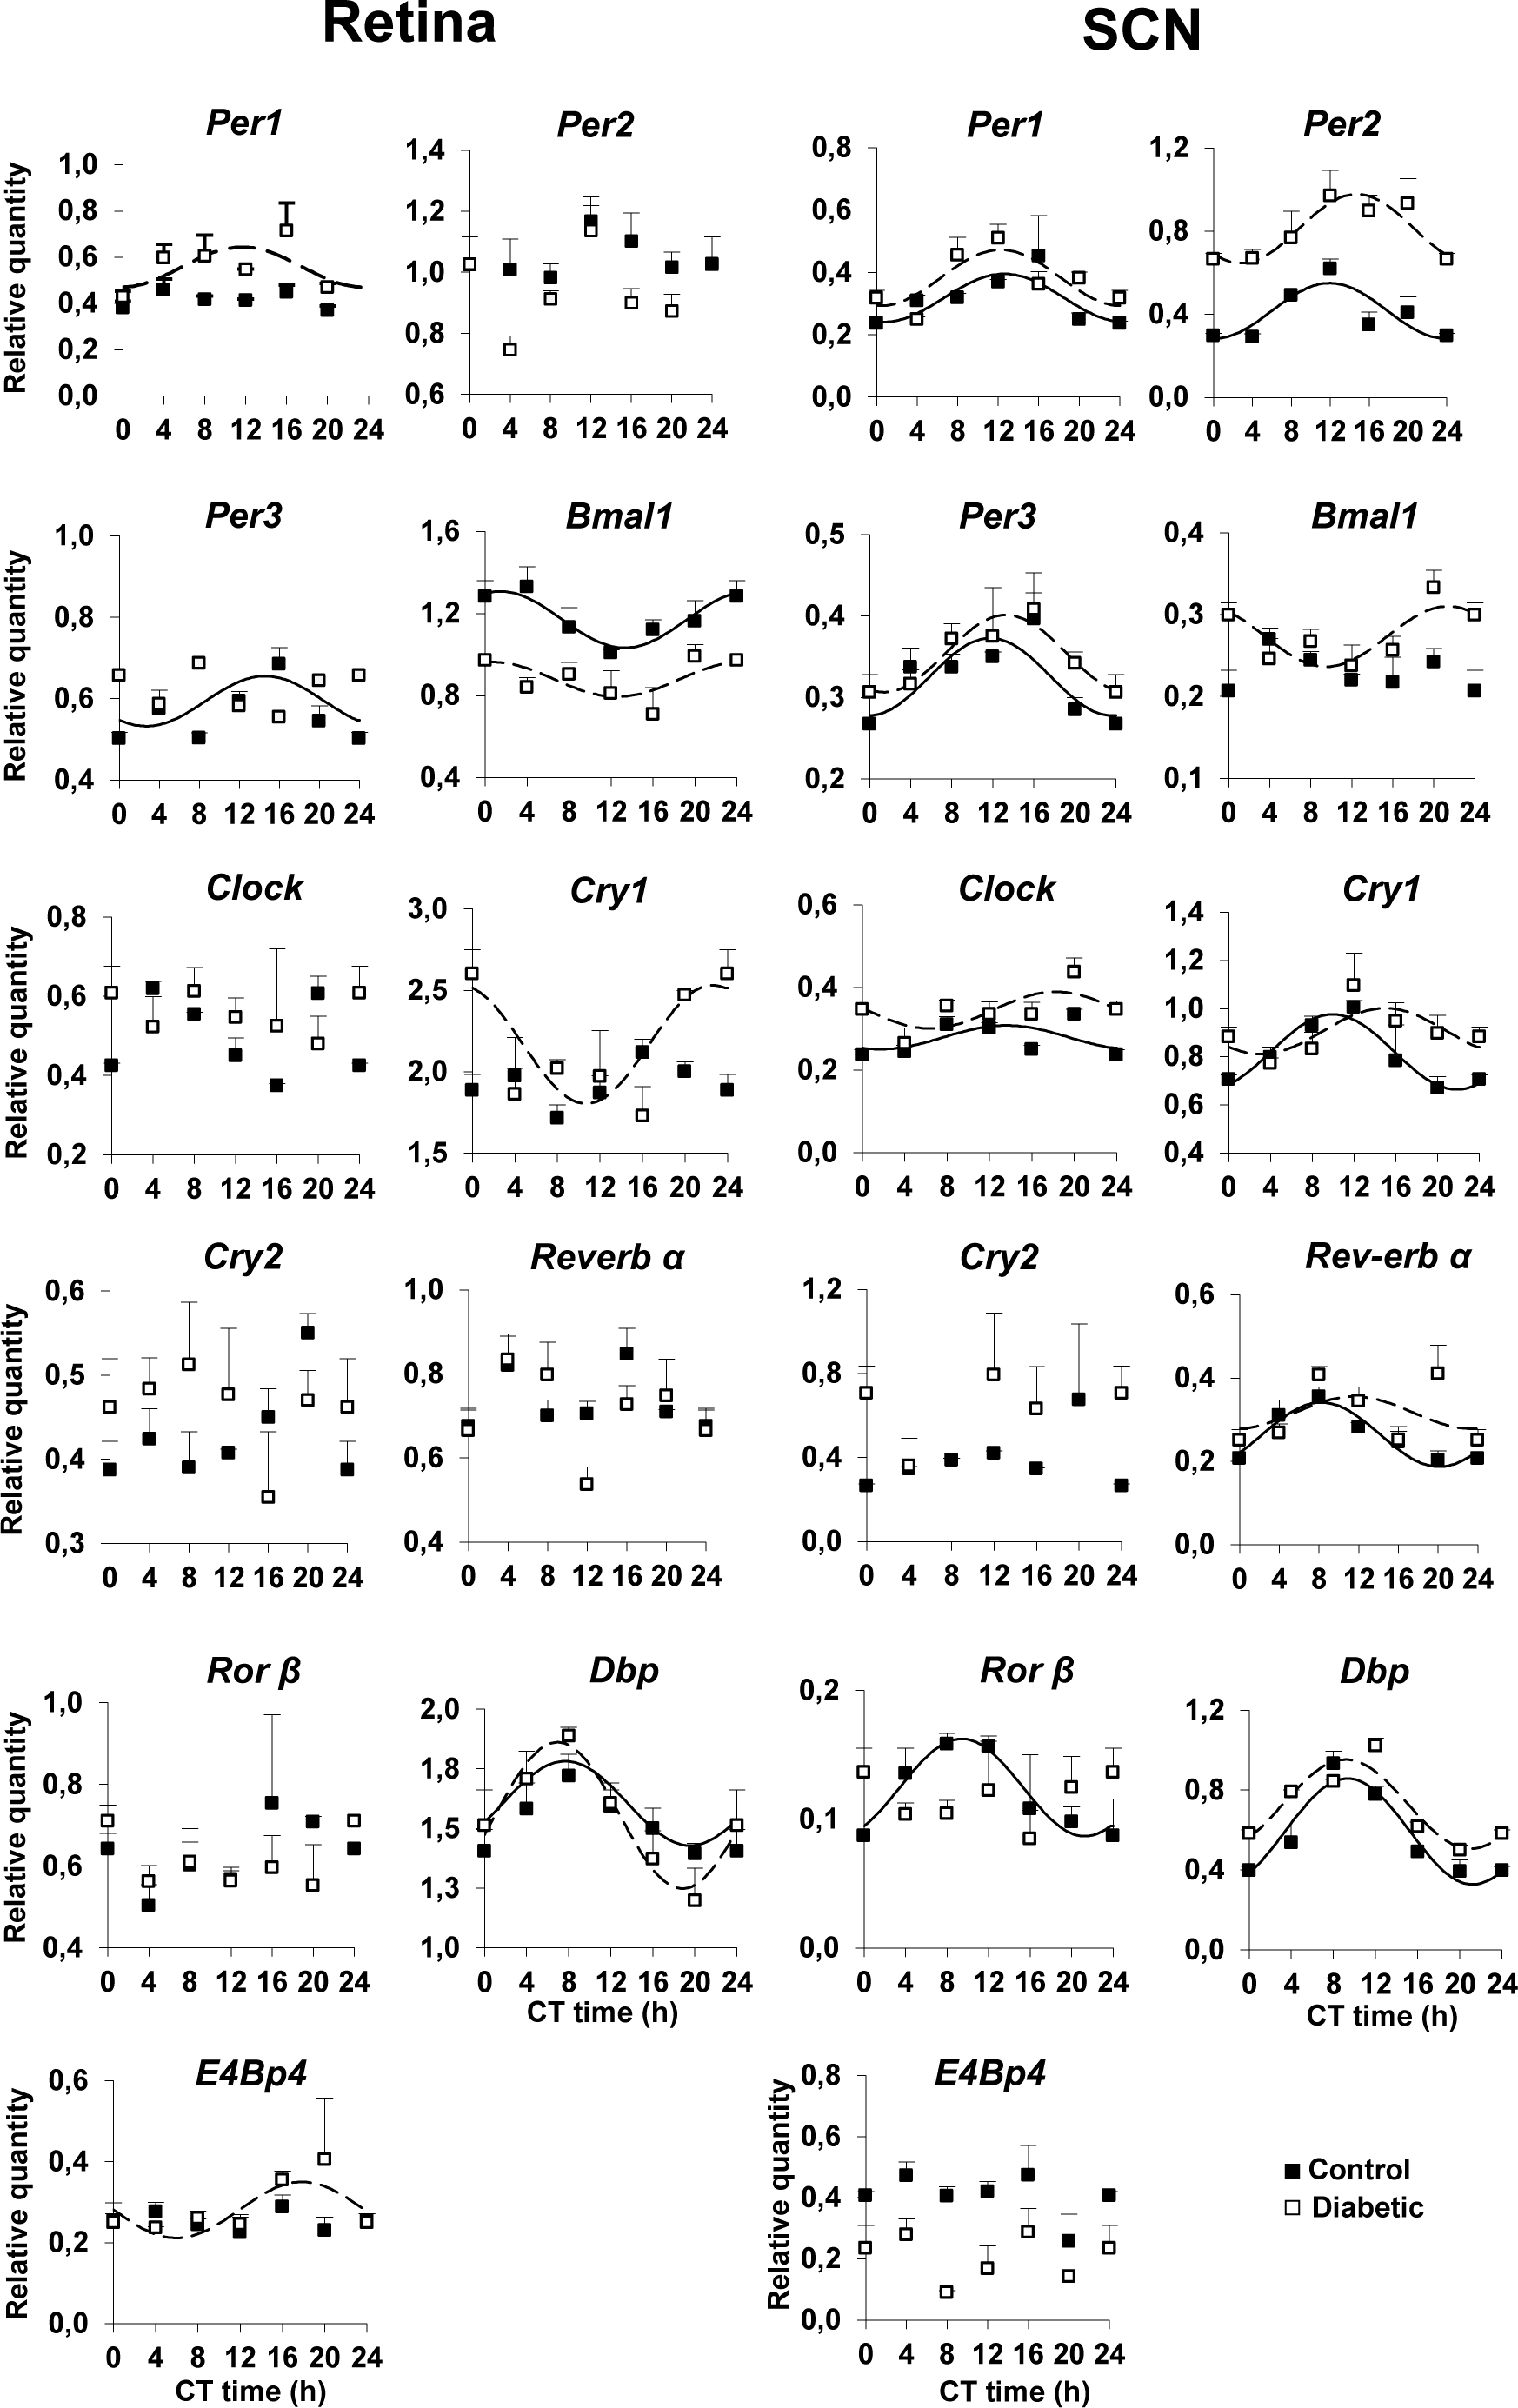
 Figure 1 of
Lahouaoui, Mol Vis 2016; 22:959-969.
Figure 1 of
Lahouaoui, Mol Vis 2016; 22:959-969.