Figure 4. Kinetic analysis and HPLC confirmation of retinol photodecomposition. A: The three-dimensional data from the previous figure were corrected for the increased path length and subjected to singular
value decomposition (SVD). Three spectral intermediates are resolved indicated by the purple, blue, and green intermediates
representing species I, II, and III, respectively. B: The analysis favors a reaction mechanism: I -> II -> III. C: High-performance liquid chromatography (HPLC) analysis of the reactants at the beginning (blue) and the conclusion of the
light exposure (red; note that red chromatogram is displayed at tenfold higher gain compared to the blue profile). The mobile
phase consisted of 10% dioxane in hexane (1.0 ml/min) monitored at 318 nm. In line spectral analysis of the peak, with λmax = 324.7 nm (arrow, prelight exposure) is consistent with all-trans retinol. The 16 min peak = 13-cis retinol. D: Residual plot confirms the fit accuracy.
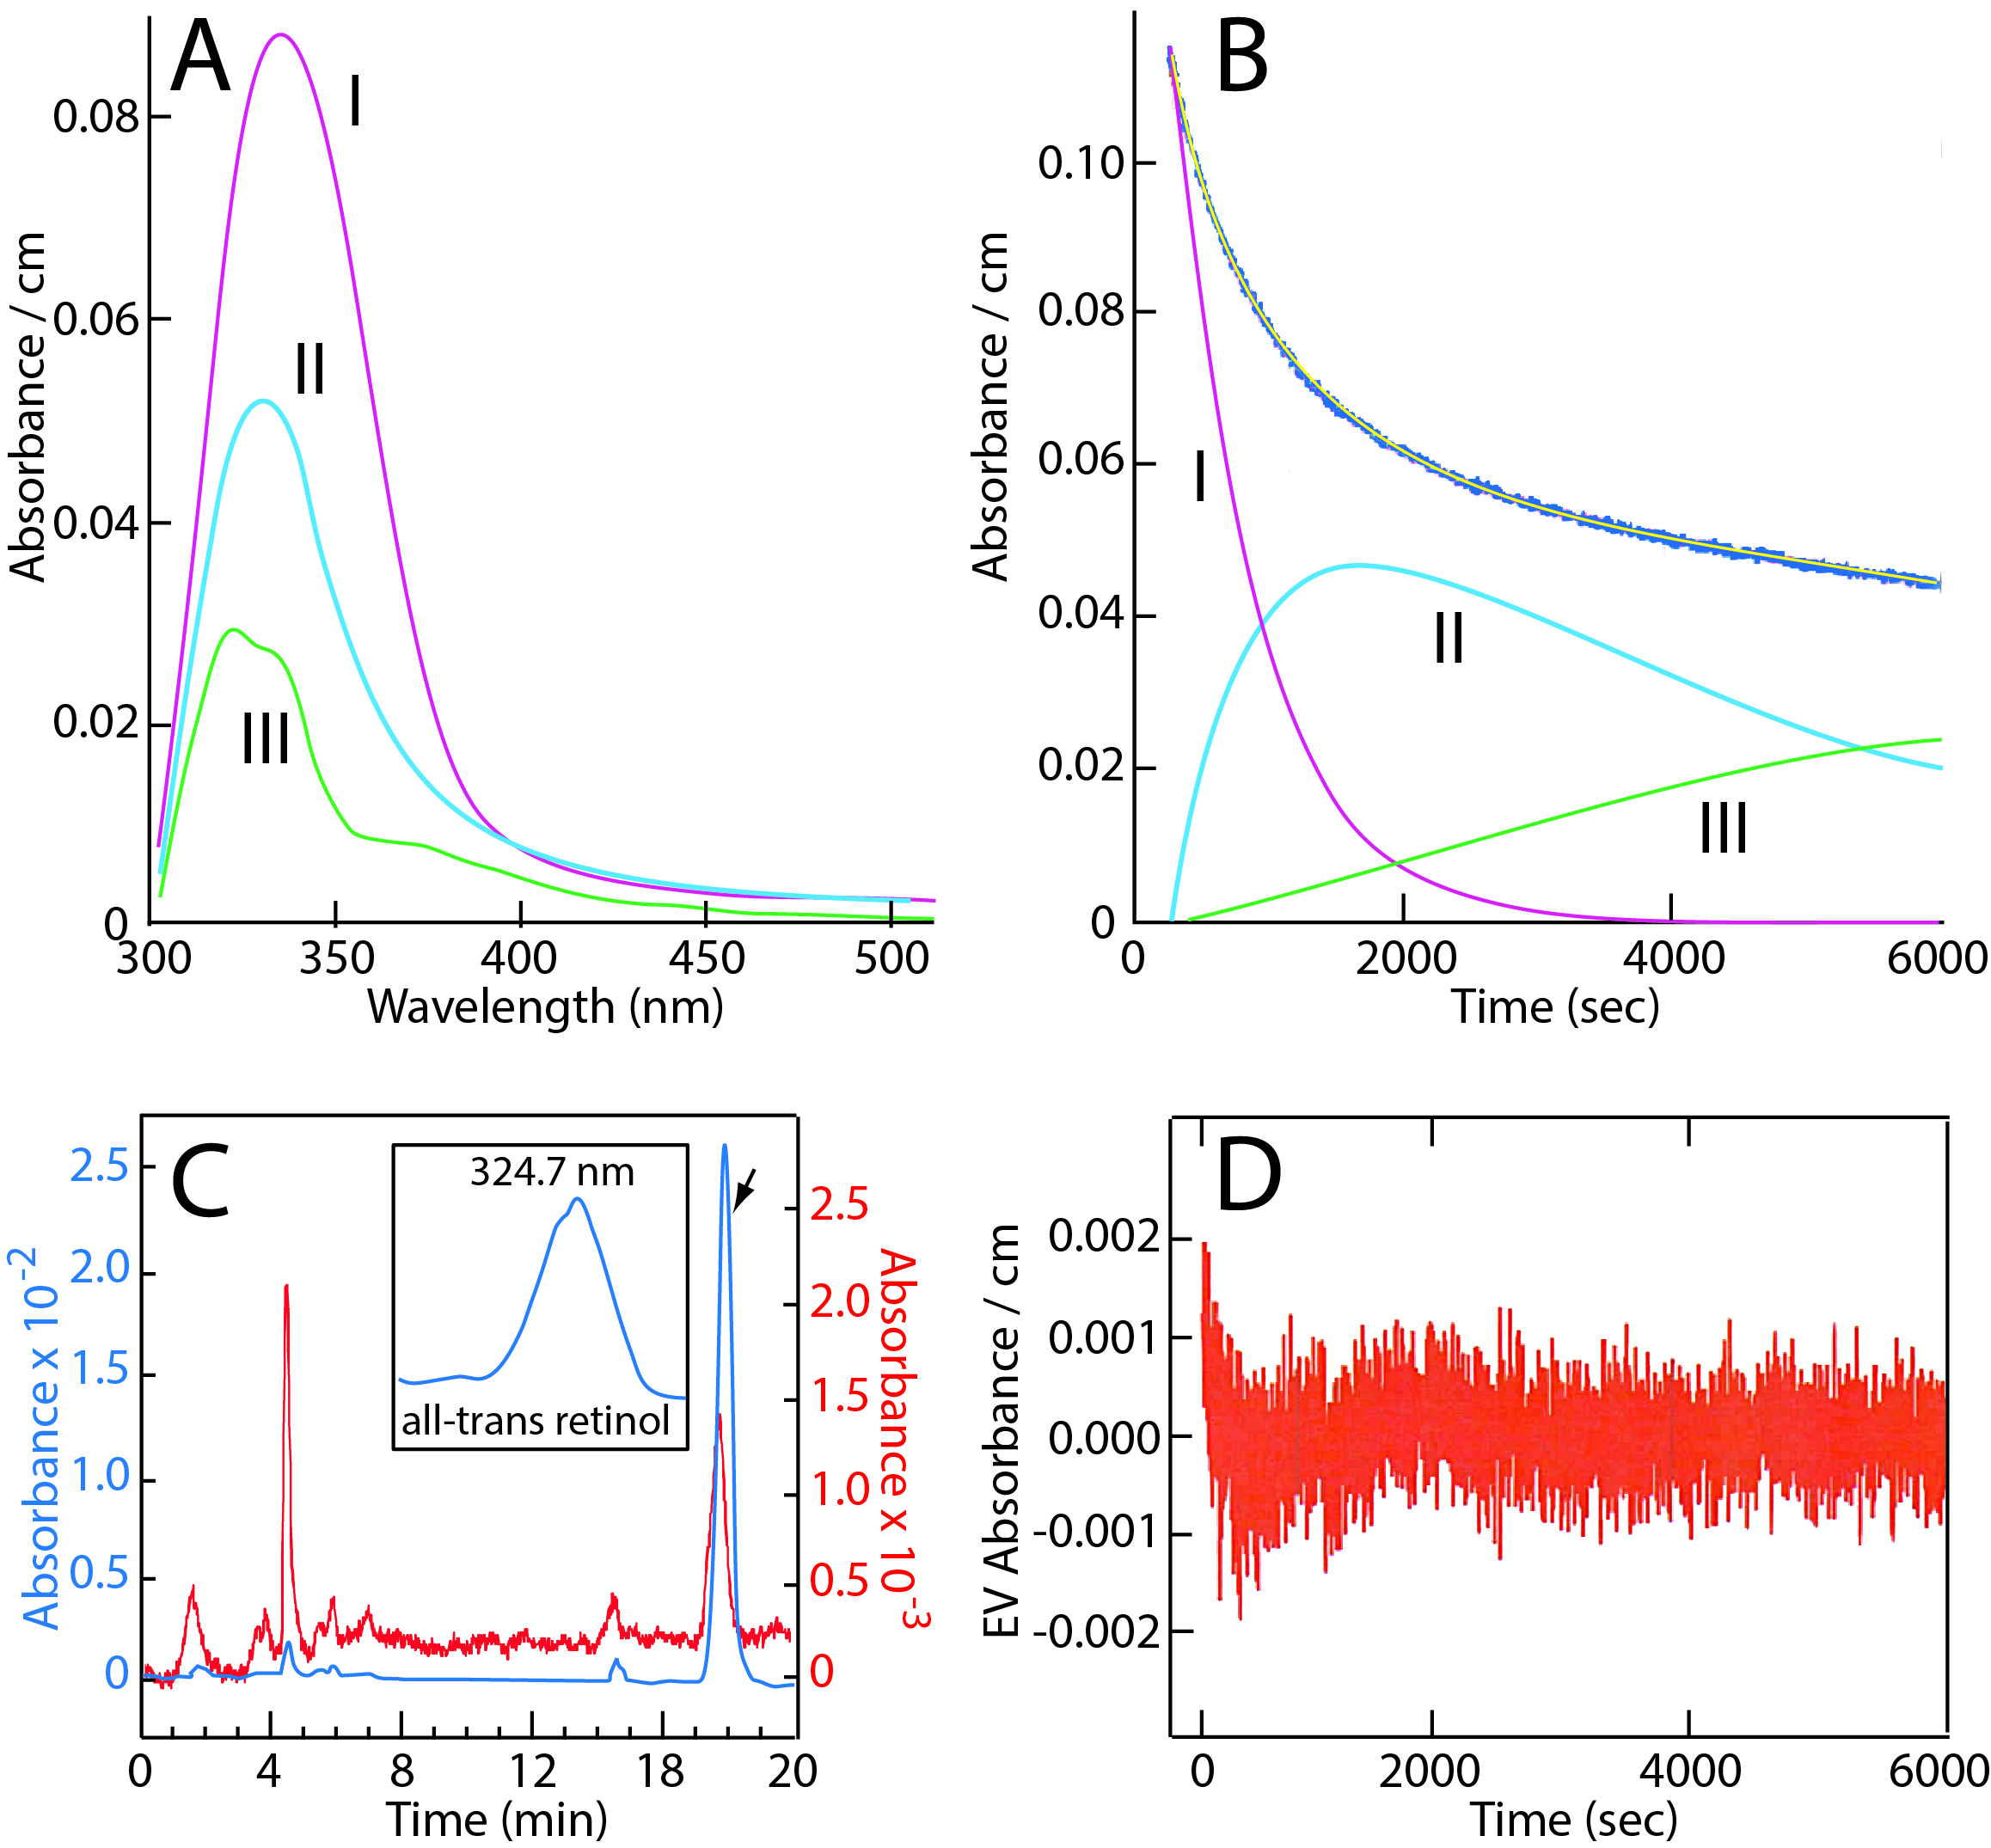
 Figure 4 of
Gonzalez-Fernandez, Mol Vis 2016; 22:953-958.
Figure 4 of
Gonzalez-Fernandez, Mol Vis 2016; 22:953-958.