Figure 3. Photodecomposition of all-trans retinol followed through rapid spectral scans interleafed between the actinic LED flashes. The all-trans retinol concentration was 10 µM in 8.6 ml of PBS, pH 7.4. Retinol likely existed as a combination of monomers, multimers,
and micelles. Nevertheless, each form would be exposed to the actinic light. One hundred scans are taken per second for 5,000
s. Scans were averaged to two scans per second. Ten such averaged scans are shown (one scan per minute). The actinic light-emitting
diode (LED) peak output was 366 nm driven at 100 flashes/sec. The insert shows the data in three-dimensional representation.
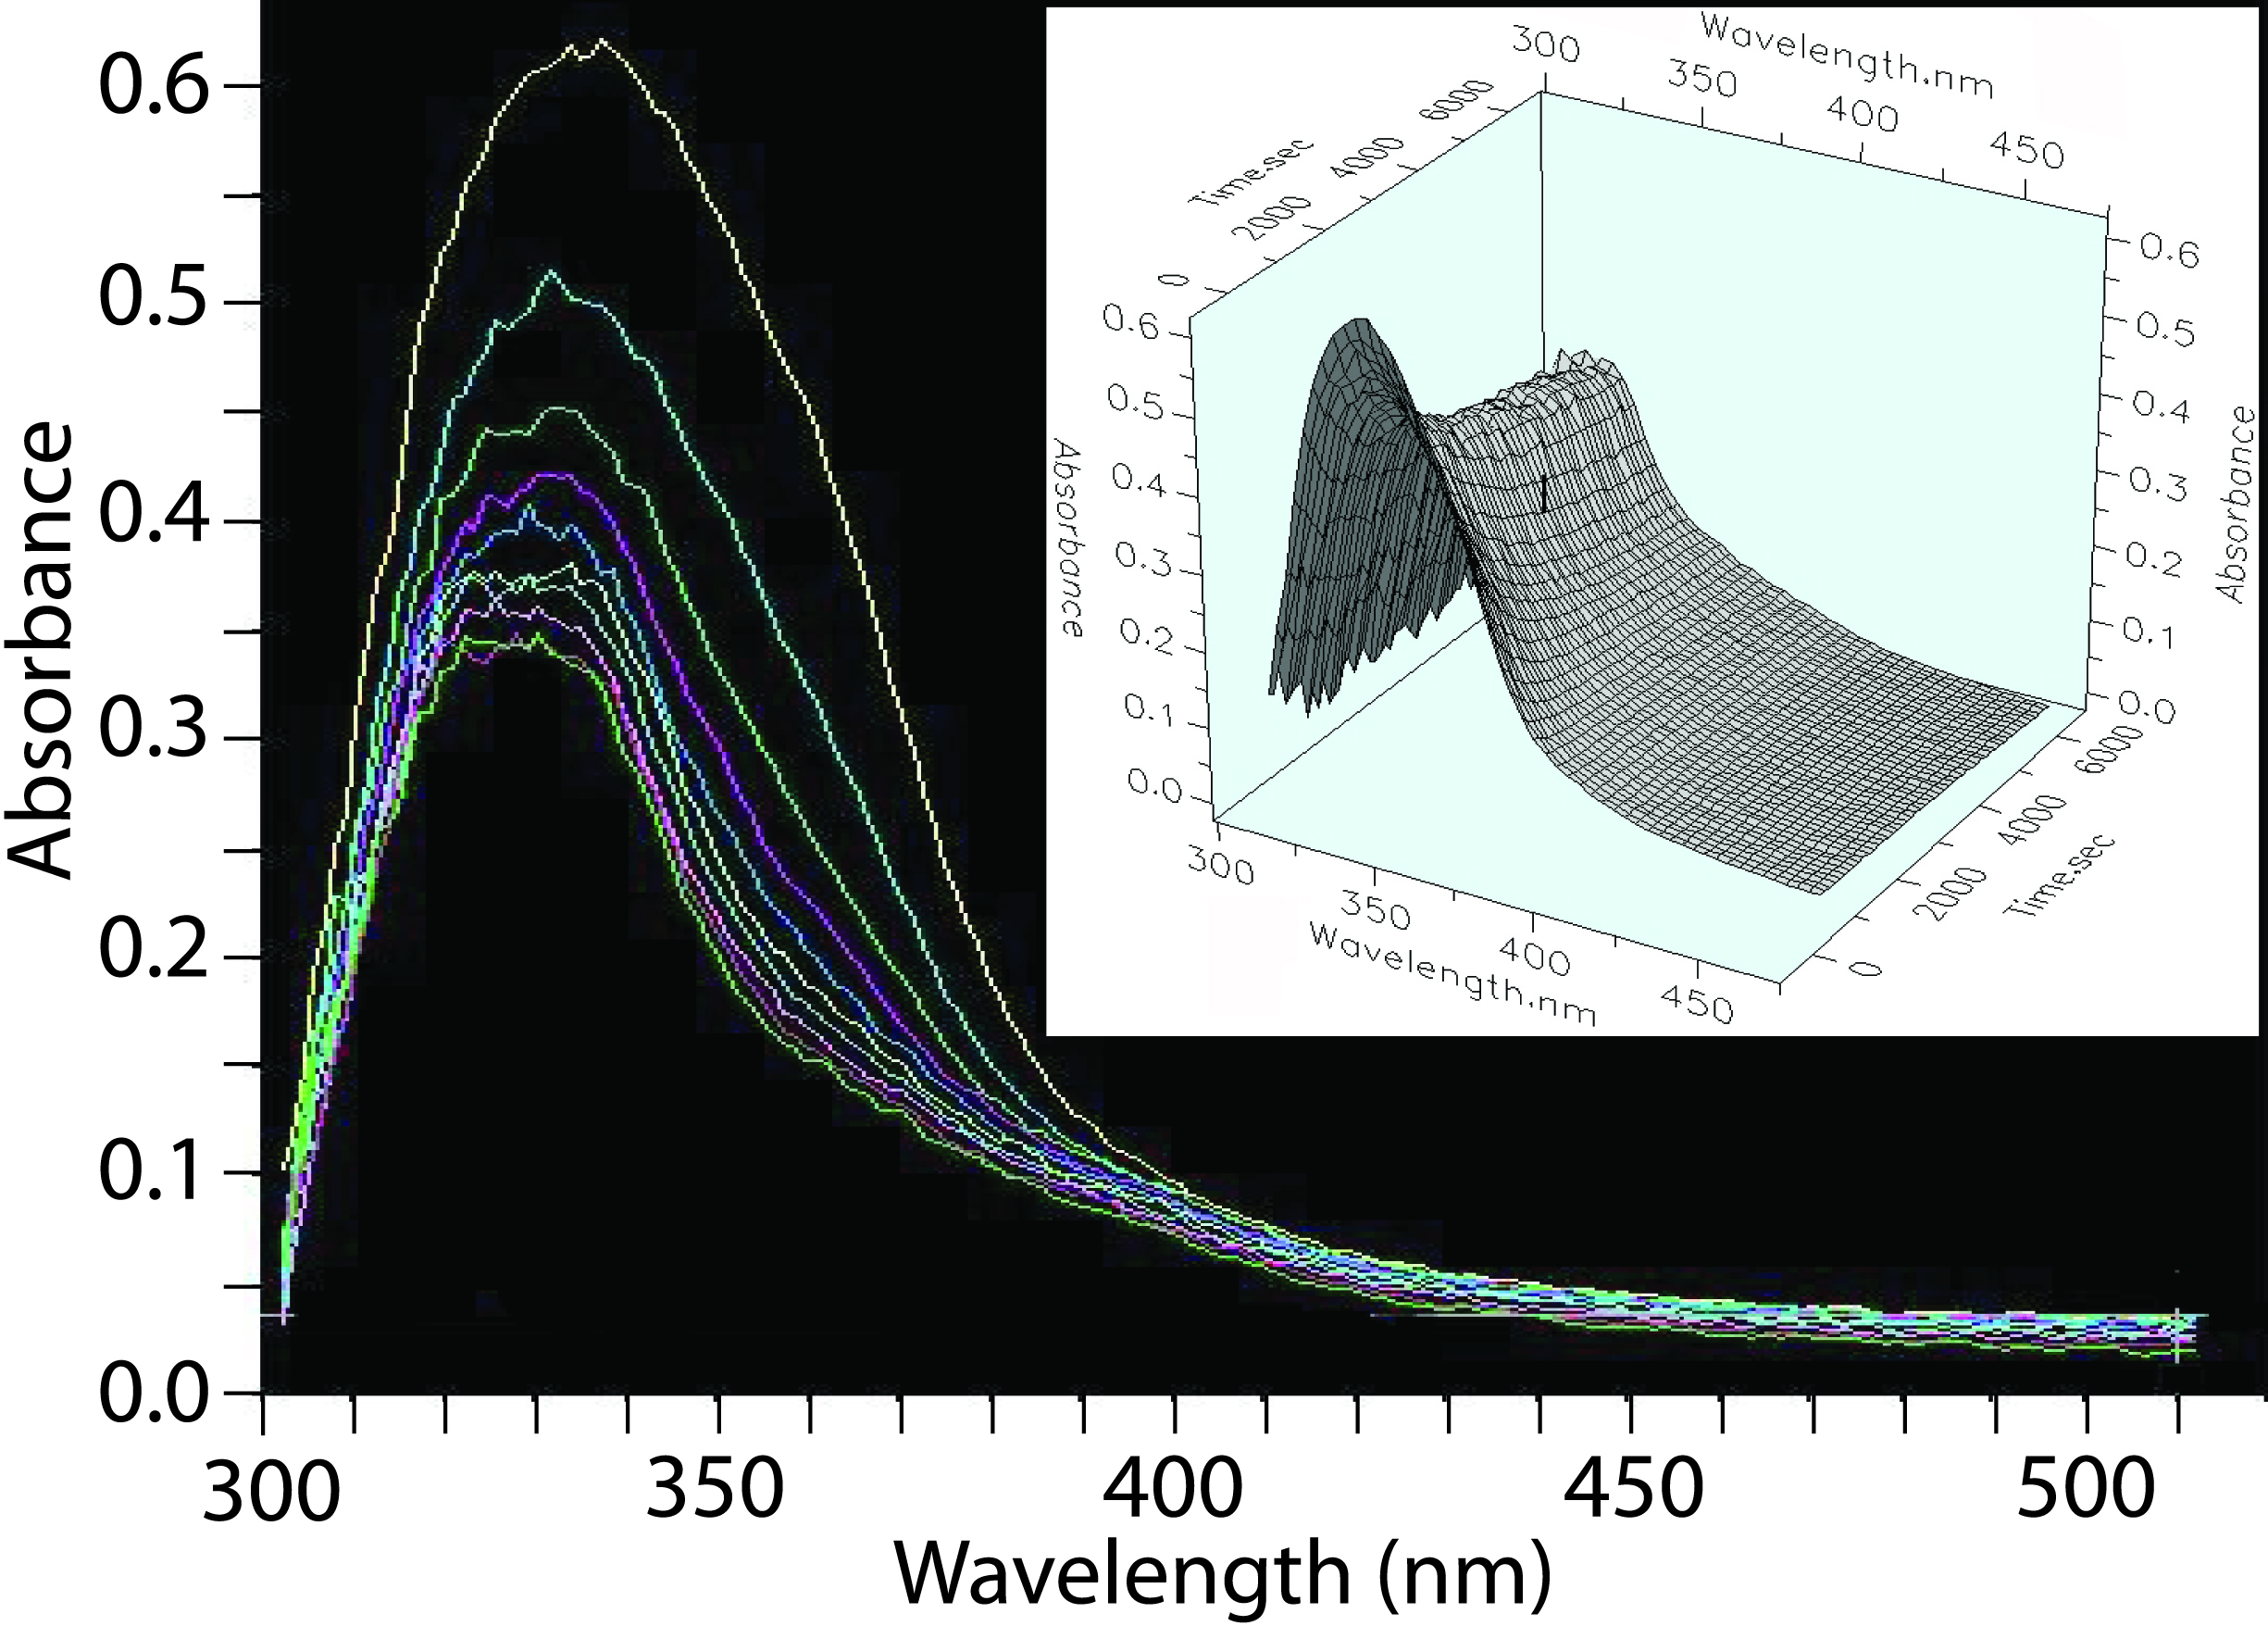
 Figure 3 of
Gonzalez-Fernandez, Mol Vis 2016; 22:953-958.
Figure 3 of
Gonzalez-Fernandez, Mol Vis 2016; 22:953-958.