Figure 2. Example of quantification of NETs in different specimens. Row 1: none, Row 2: +, Row 3: ++, Row 4: +++, respectively, representing
the number of DNA-releasing neutrophils as +: <10%, ++: 10% to 30%, and +++: 31% to 50%. The negative control was taken from
a negative field of a positive sample. The structure of the multilobular nuclei of neutrophils can be seen in the left top
image indicated with an arrow. Morphology of fungal hyphae was also determined in the Row 4 images (arrowhead). DNA (left
panel), elastase (middle panel), Merge (right panel). Bar: 100 μm.
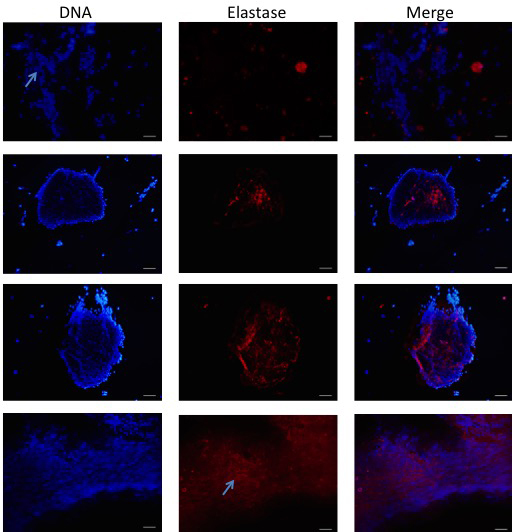
 Figure 2 of
Jin, Mol Vis 2016; 22:944-952.
Figure 2 of
Jin, Mol Vis 2016; 22:944-952.