Figure 3. Western blot showing the levels of expression of CRBB2 in group A (standard axis length with nuclear cataract) compared with
group B (longer axis length with nuclear cataract). β-Actin was used as a loading control. A: Representative images of the western blots. B: The expression of CRBB2 was decreased in the group with longer axis length nuclear cataract (A), *p< 0.05 versus group B
(n = 5 per group).
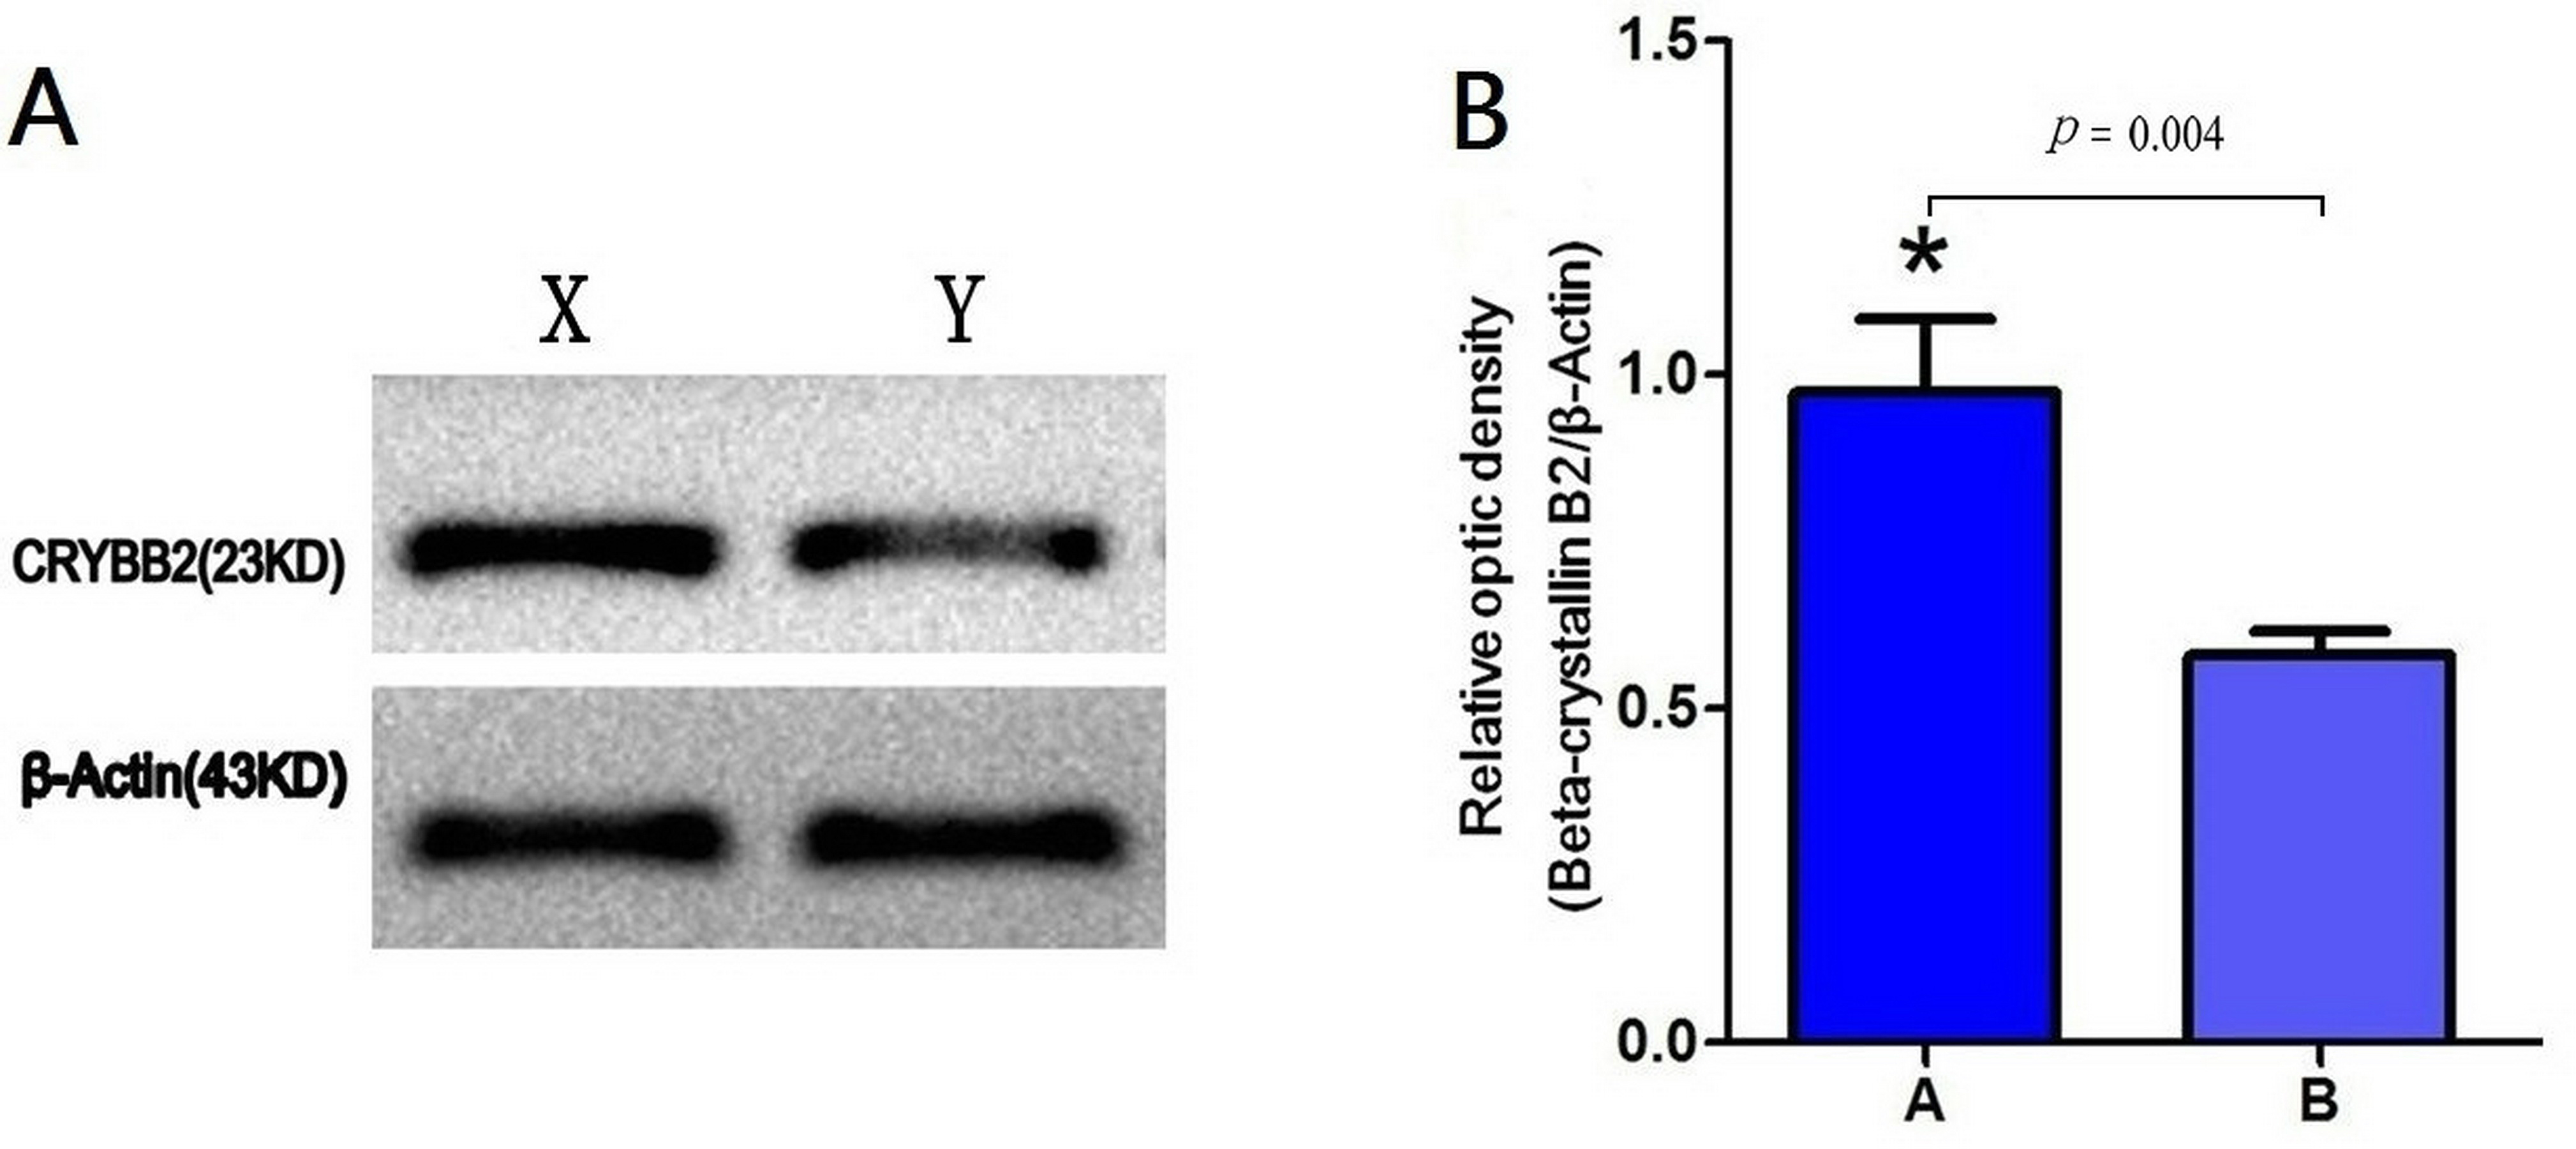
 Figure 3 of
Zhou, Mol Vis 2016; 22:933-943.
Figure 3 of
Zhou, Mol Vis 2016; 22:933-943.