Figure 8. Composite graphs showing age-related morphometric alterations in the RPE in all three areas of the retina. Various morphometric
measurements from three areas of the retina are plotted against age. In general, the mid-periphery was resistant to change
over age, while the macula and the far periphery showed similar trends in changes with age in all metrics except eccentricity.
A: Cell density. B: Cell area. C: eccentricity. D: Form factor. E: Percentage of hexagonal cells. Each point on the graph represents an average of measurements taken from three images from
a single donor. The error bars represent the standard deviation of those three measurements.
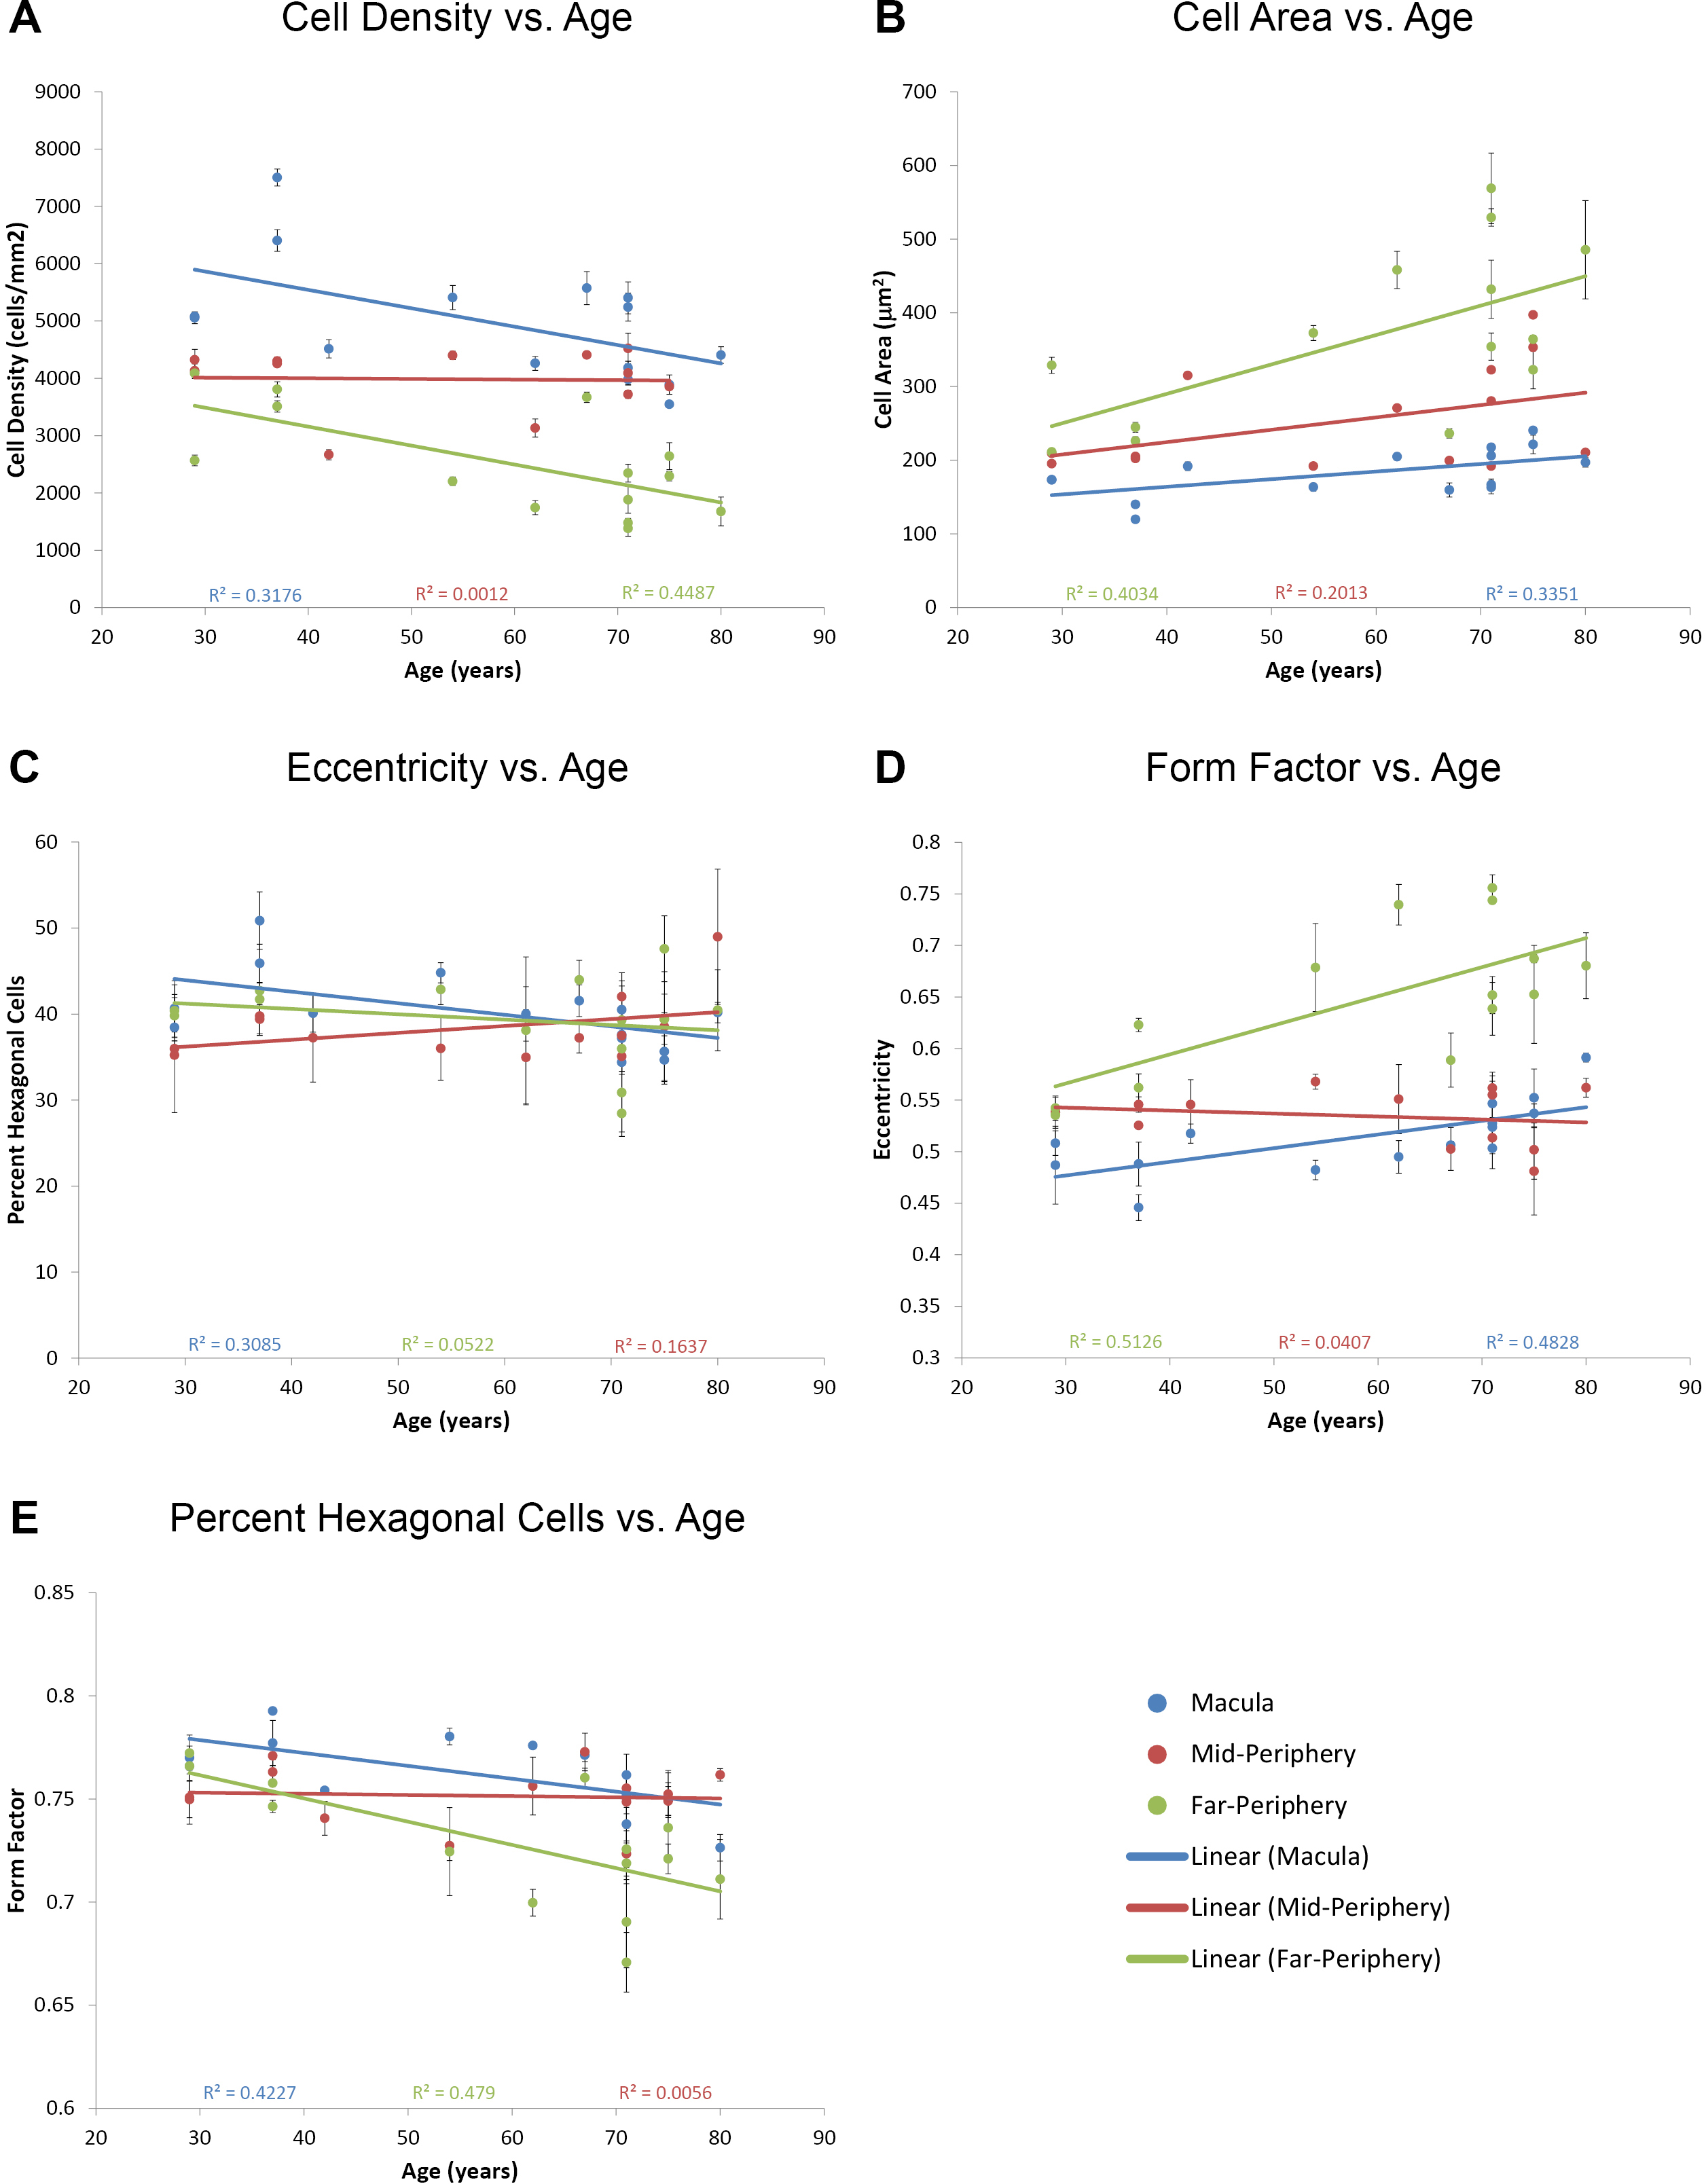
 Figure 8 of
Bhatia, Mol Vis 2016; 22:898-916.
Figure 8 of
Bhatia, Mol Vis 2016; 22:898-916.