Figure 7. Analysis of spatial variation of RPE morphometry. A: Average cell density. B: Average cell area. C: Average eccentricity. D: Average form factor. E: Average percentage of hexagonal cells. These were averaged across all age groups in three areas of the retina. Error bars
represent standard deviations. One-way ANOVA with Tukey’s multiple comparisons test. P values are provided on the image. RPE
cells in the macula and the mid-periphery were generally similar in area and shape while the far periphery differed with larger
areas of more irregularly shaped RPE cells.
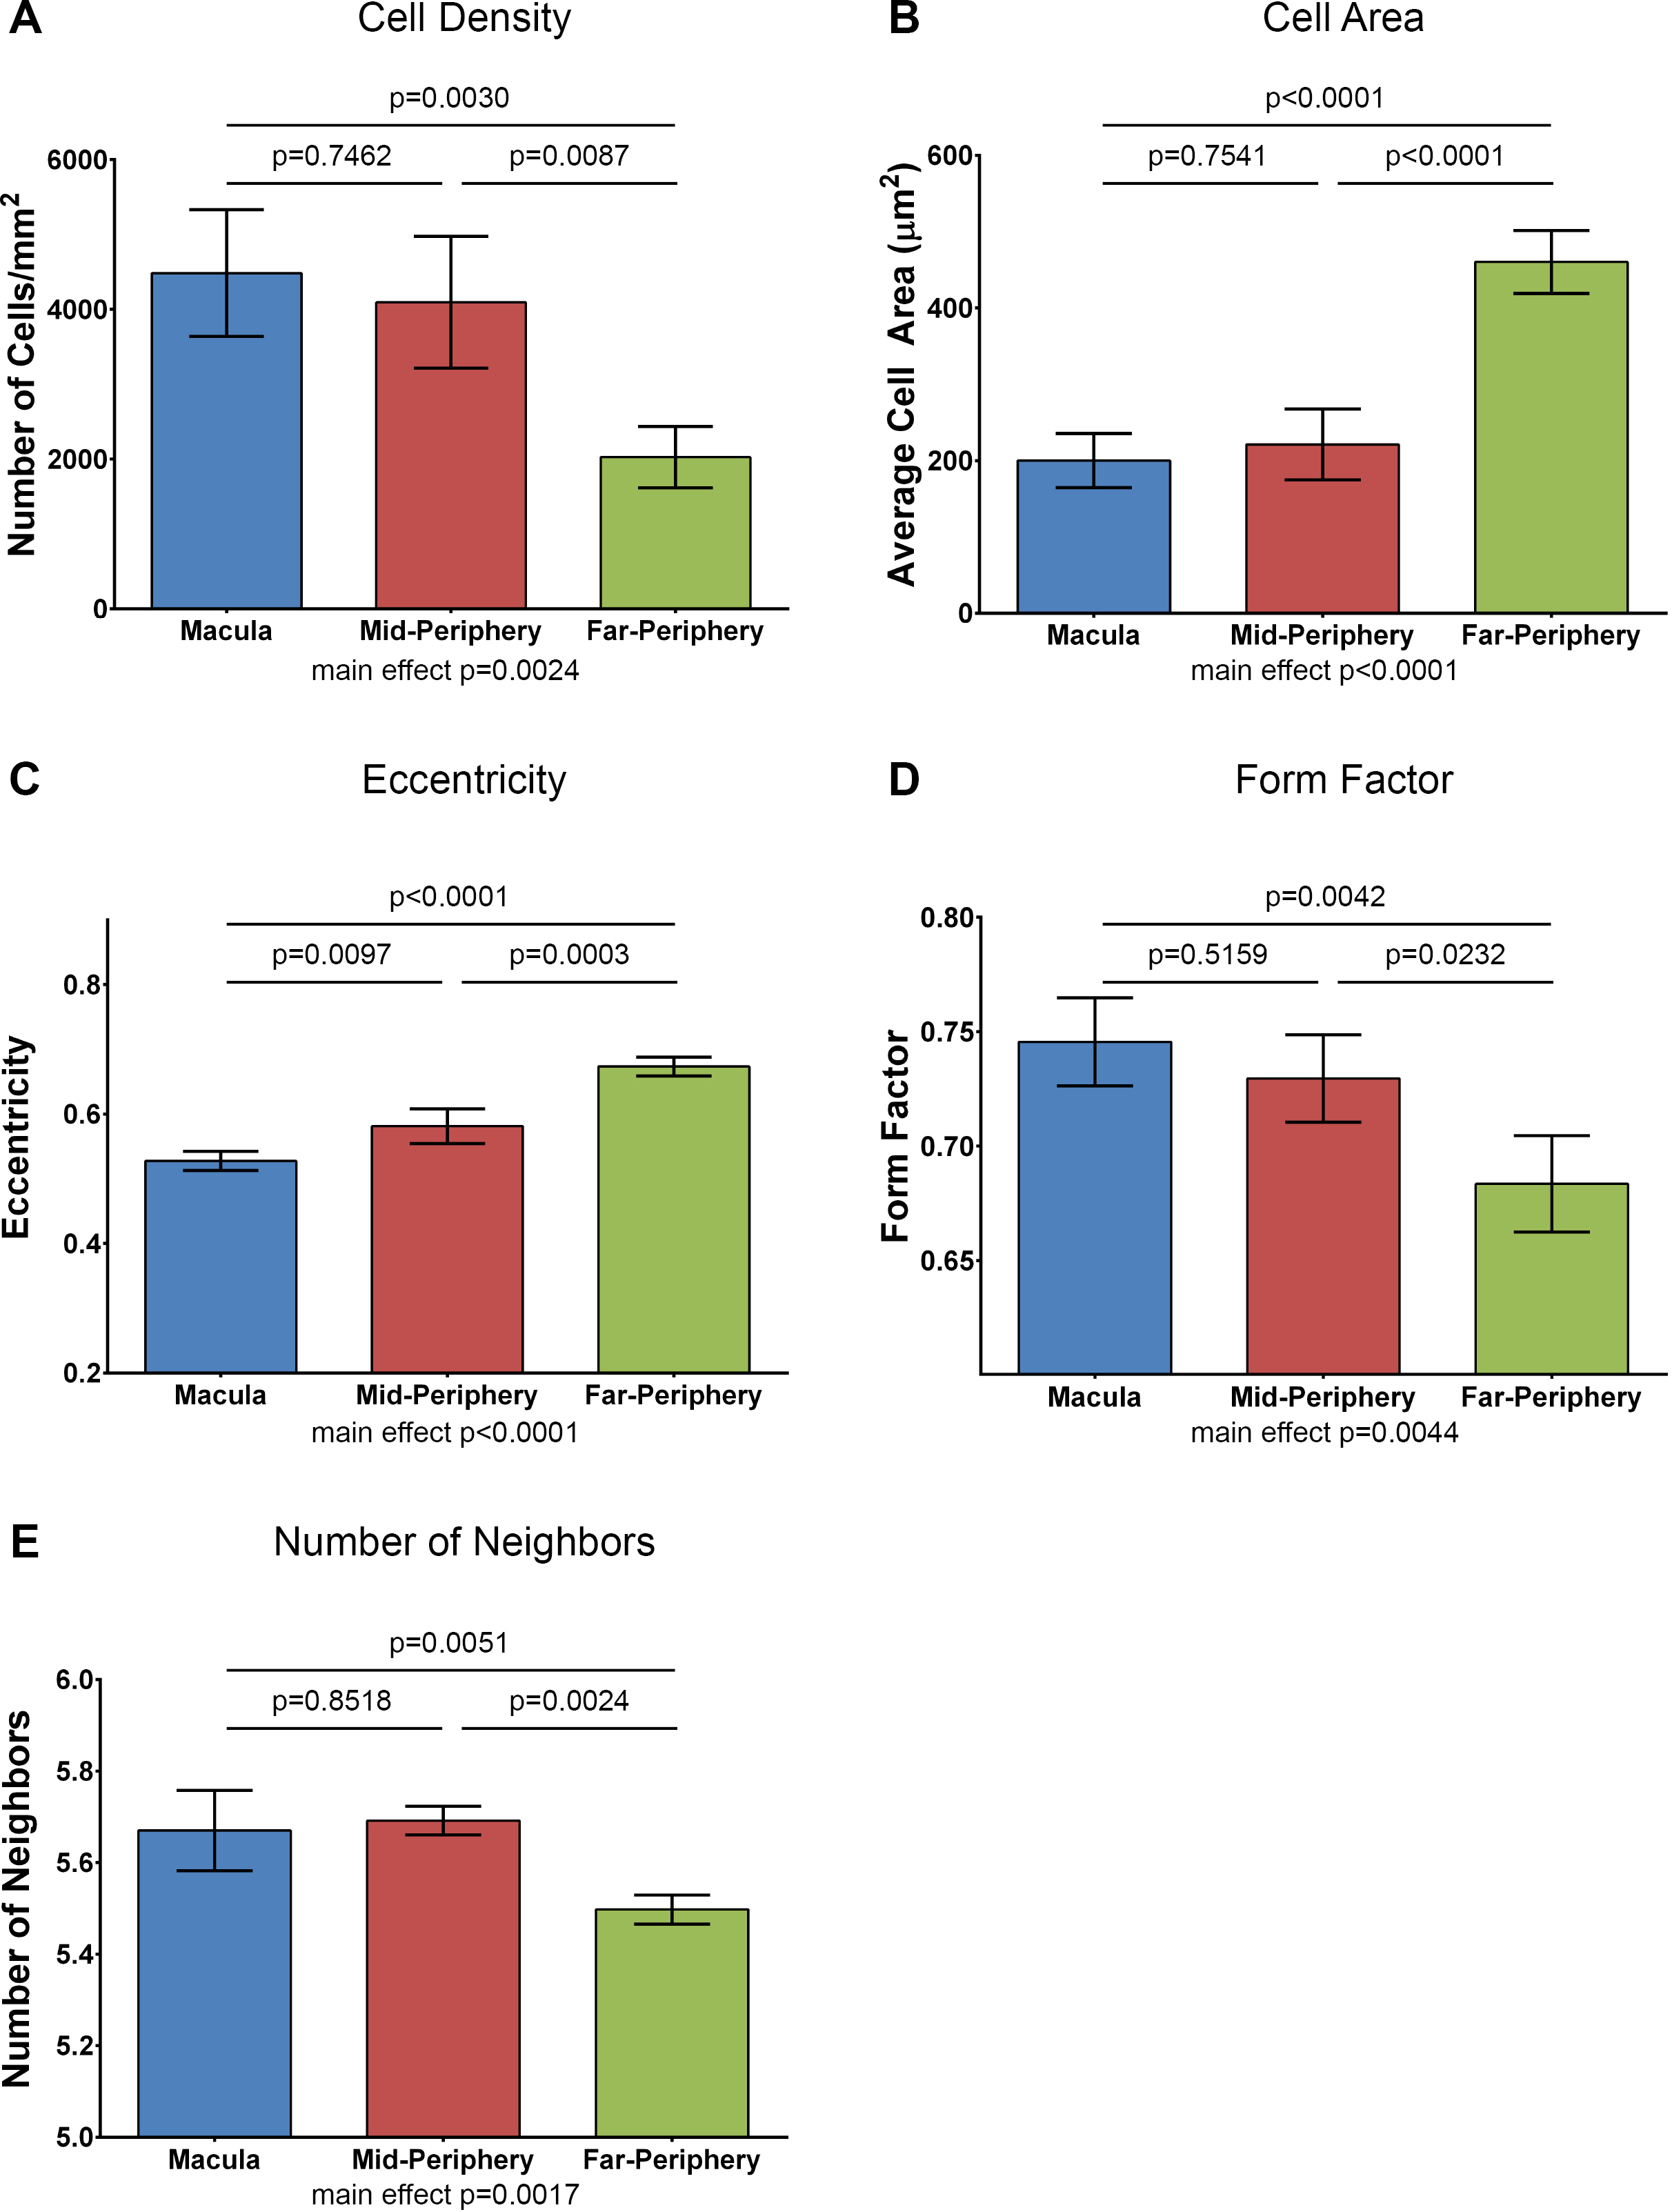
 Figure 7 of
Bhatia, Mol Vis 2016; 22:898-916.
Figure 7 of
Bhatia, Mol Vis 2016; 22:898-916.