Figure 6. Correlation analysis. A: There is a perfect correlation between the reciprocal of the average cell area and cell density (because there were no extracellular
gaps, spaces, or atrophic regions between cells). B: There is a strong negative correlation between average form factor and average eccentricity, confirming integrity of our
data set. C: There were positive correlations between the average cell area and average eccentricity. D: There were positive correlations between cell density and average form factor. E: Negative correlations exist between the average cell area and the form factor. F: Negative correlations exist between the cell density and average eccentricity.
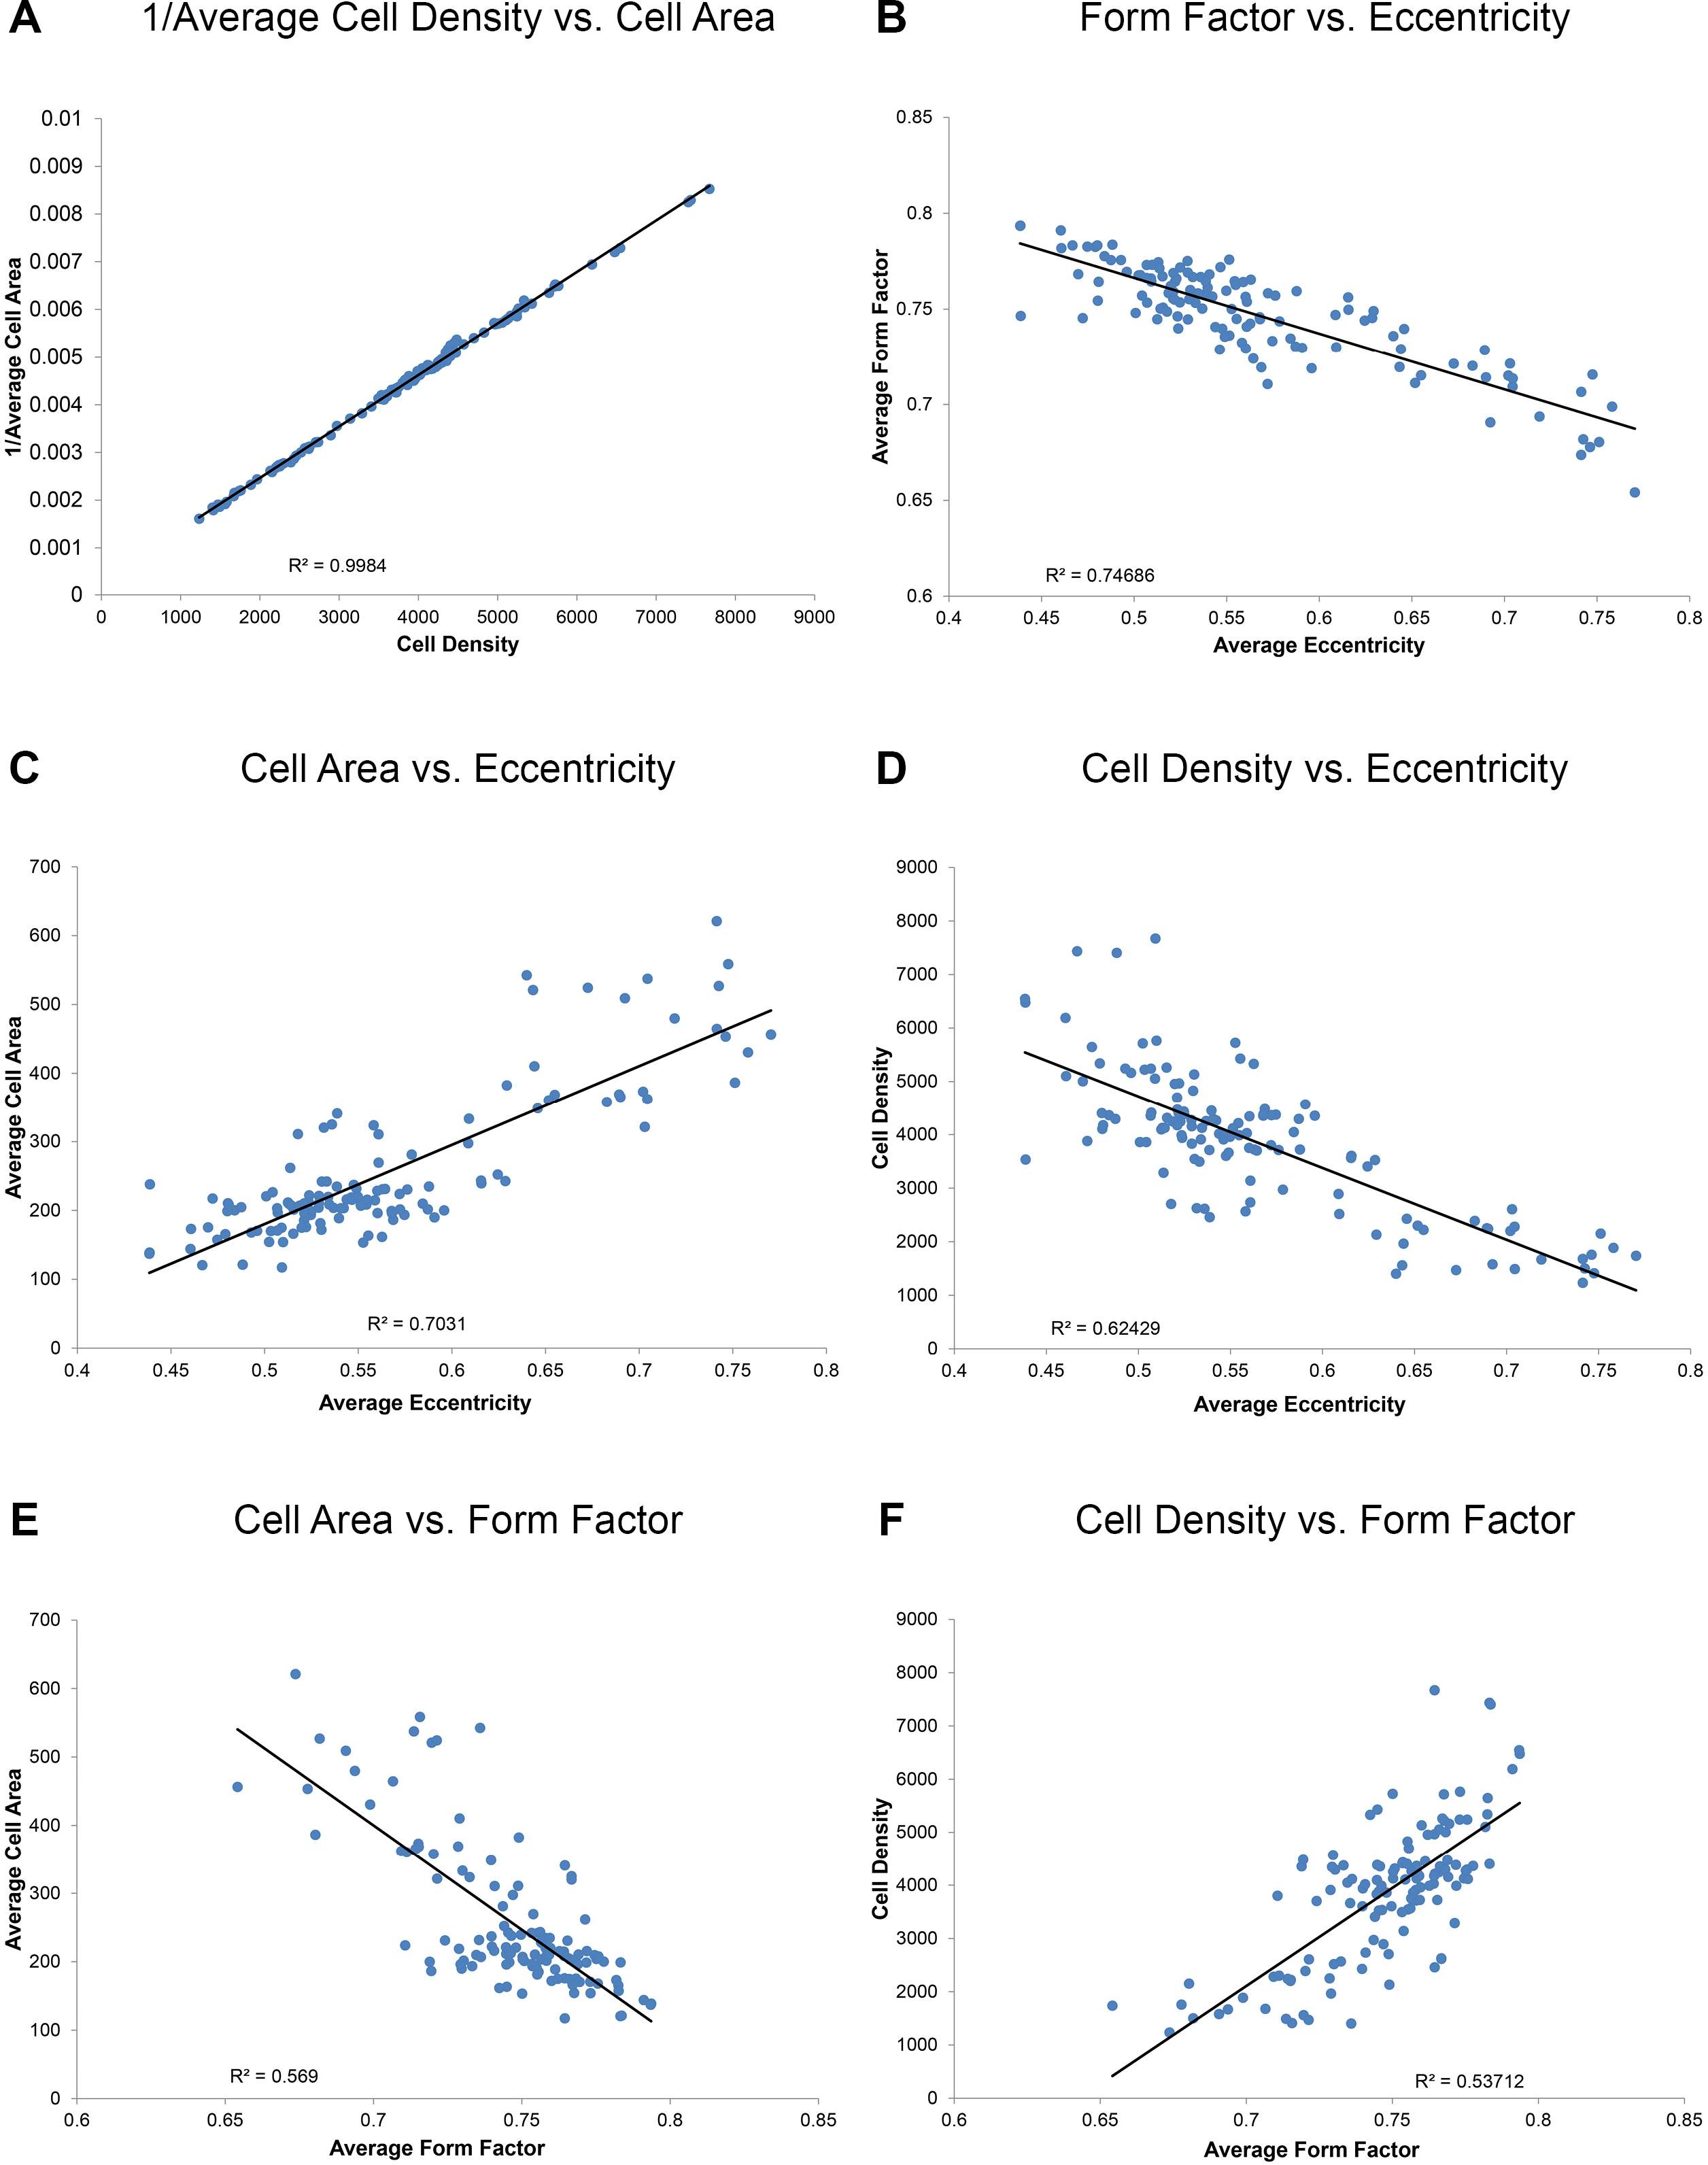
 Figure 6 of
Bhatia, Mol Vis 2016; 22:898-916.
Figure 6 of
Bhatia, Mol Vis 2016; 22:898-916.