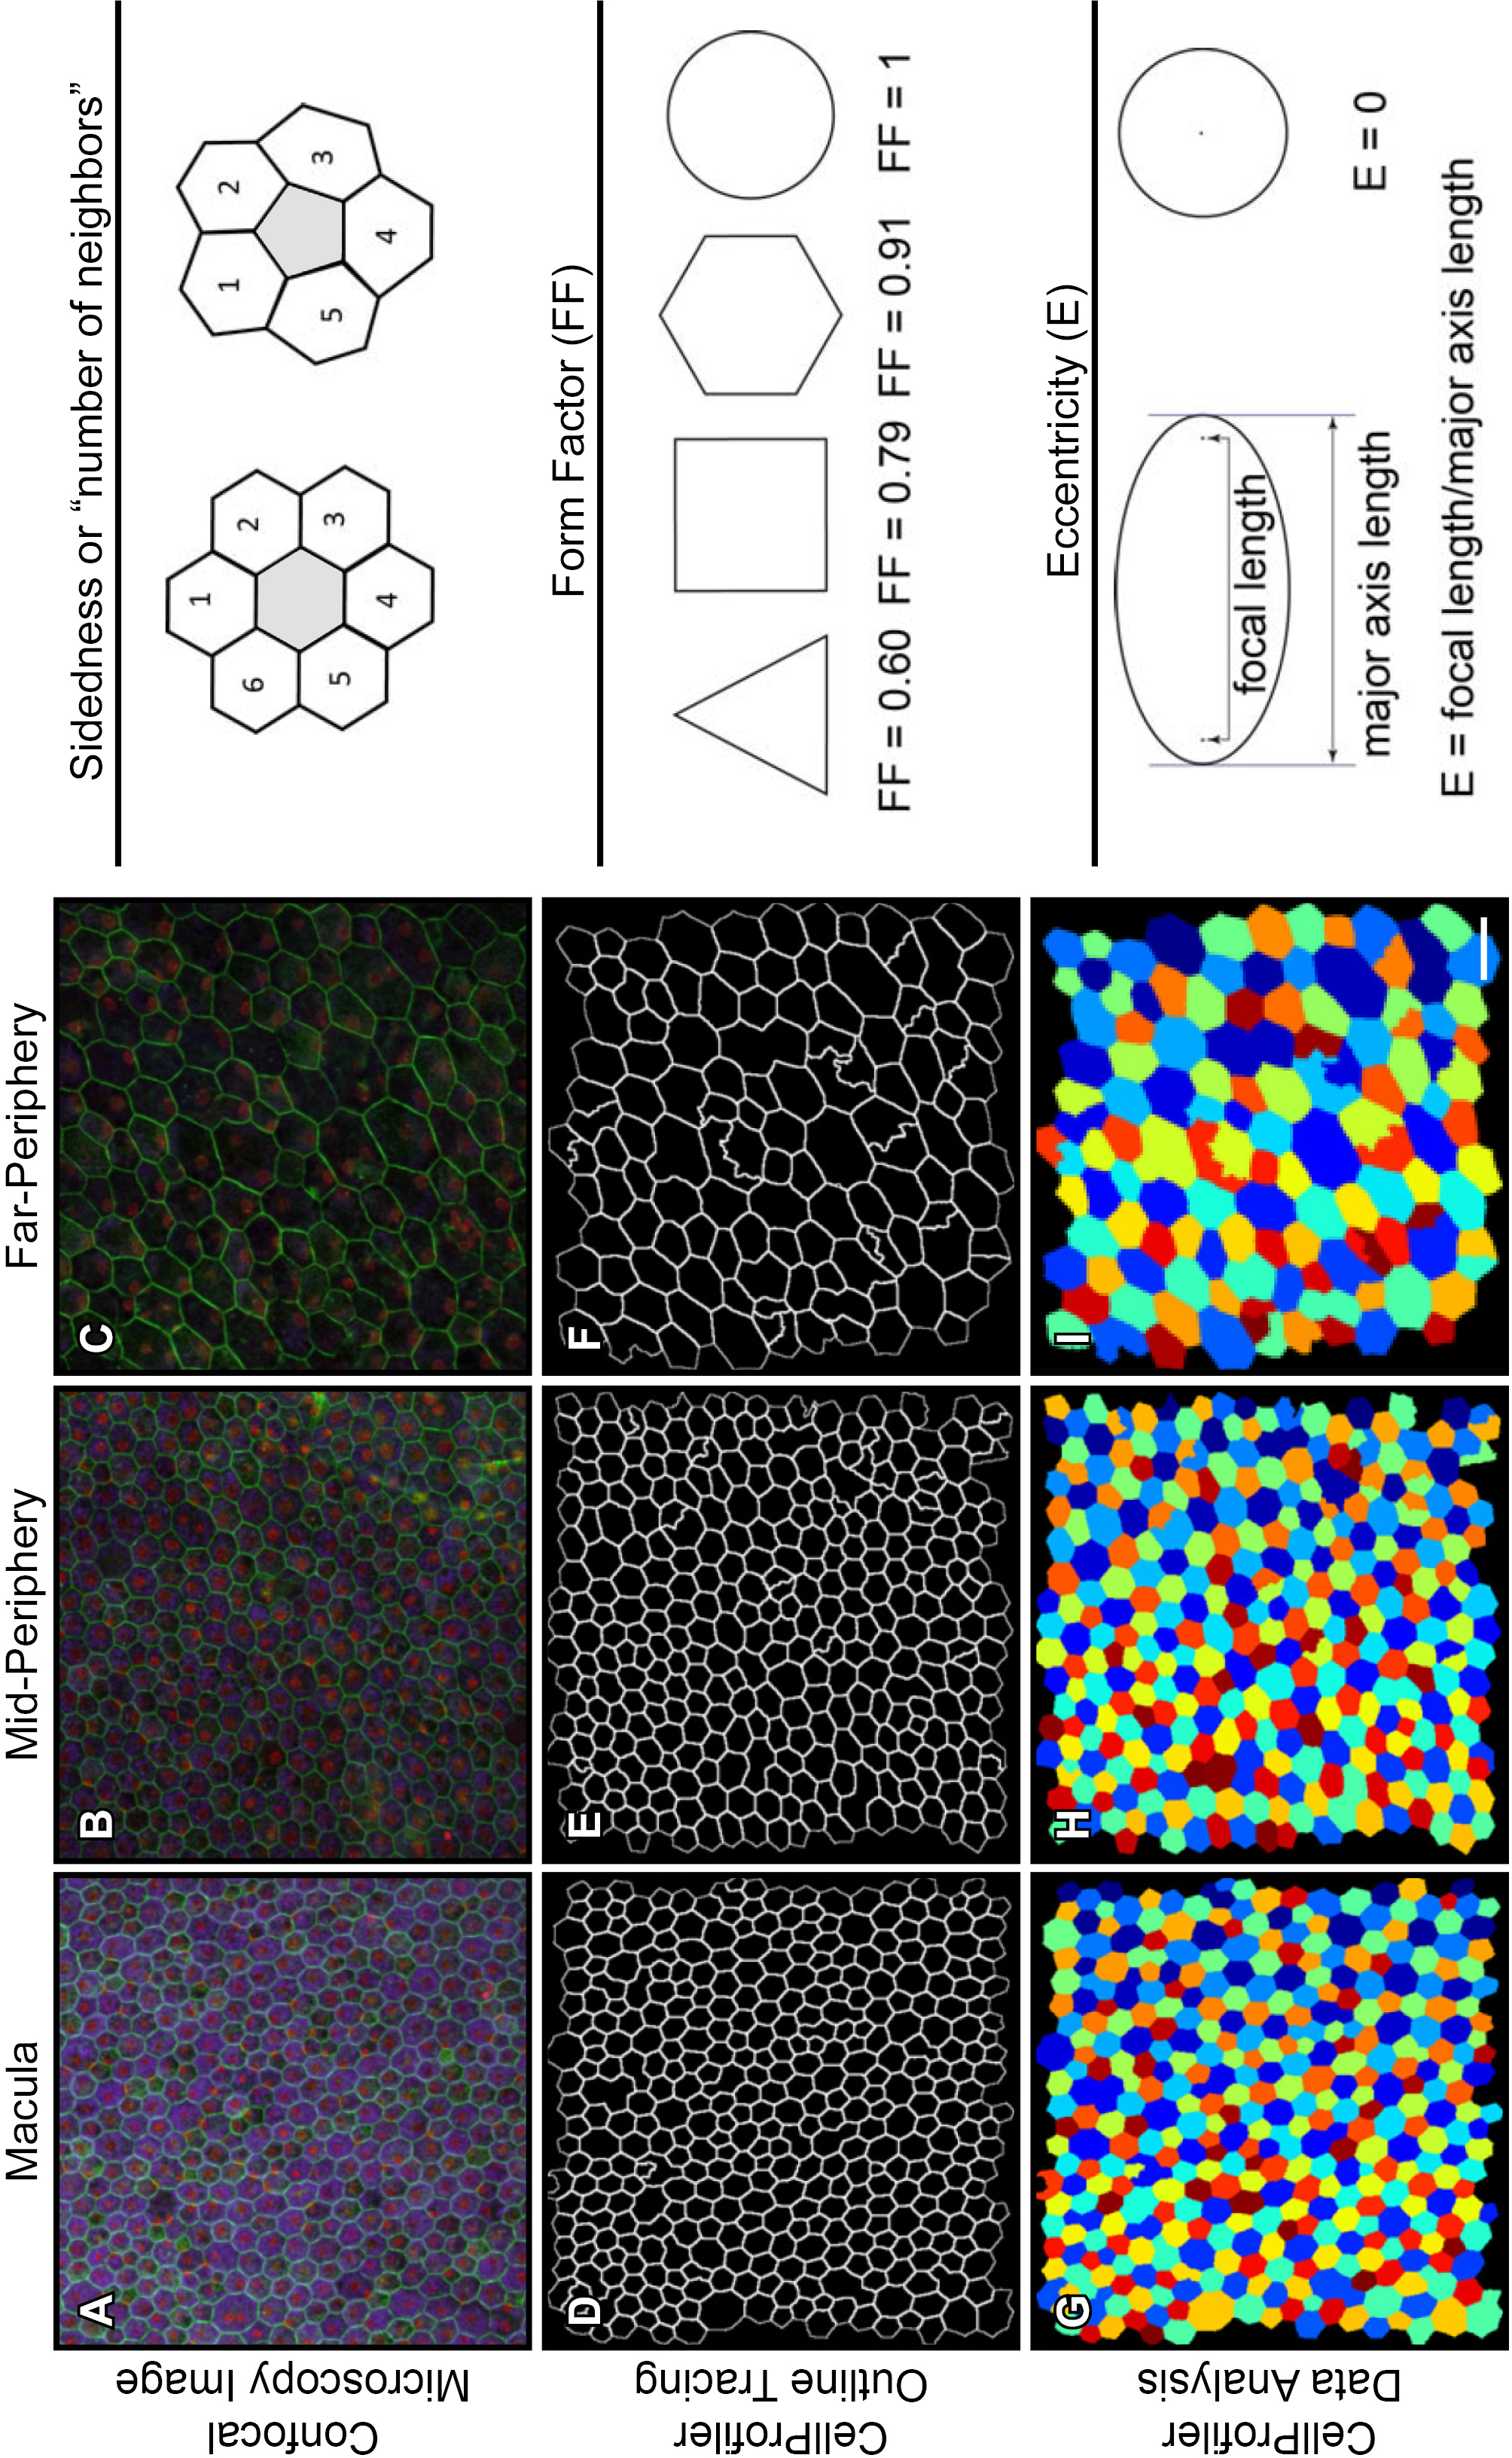
Figure 3. Image analysis techniques.
Left: CellProfiler version 2.1.1 image analysis software was used to automatically trace cell borders from individual images (top,
original raw images; middle, traced cell borders; bottom, colored cells were analyzed). Scale bar equals 25 μm.
Right: Metrics used to evaluate each cell. Top: Sidedness, counting the number of contacting neighbor cells. Middle: Form factor,
the relationship of perimeter to area according the definition 4 π・area/perimeter
2. The form factor value for a perfect equilateral hexagon is 0.84. A decreased form factor value corresponds to a cell with
fewer sides or with sides of unequal lengths. Bottom: Eccentricity, a measure of the elongation of a cell approximated by
an elliptical shape. Eccentricity is the ratio of the focal length to the major axis length, and a higher value corresponds
to a more elongated shape. The right half is taken from Appendix 9 in reference [
24] with permission of the authors, according to CCL 3.0 BY-NC-ND.
 Figure 3 of
Bhatia, Mol Vis 2016; 22:898-916.
Figure 3 of
Bhatia, Mol Vis 2016; 22:898-916.