Figure 2. Image Selection criteria for the two studies: the location study and the aging study. A: For the location study, we stitched together a strip of images from the optic nerve head (ONH) to the far periphery and
analyzed 1,024 × 1,024 pixel images spaced apart by 2,048 pixels. Typically, this gave us 12 images that we analyzed, and
these images are marked in this representative strip as red boxes. B: For the aging study, a total of nine images were selected for analysis from each donor eye. Three images were selected from
each of the above zones. Zone 1 corresponded to the macula, identified as the area 3.0–3.5 mm from the optic nerve and the
area of the retina with the highest RPE cell density. Zone 2 corresponded to the mid-periphery, which was measured to be 9.7–11
mm from the optic nerve. Zone 3 corresponded to the far periphery, which was measured to be 18.5 to 19.2 mm from the optic
nerve.
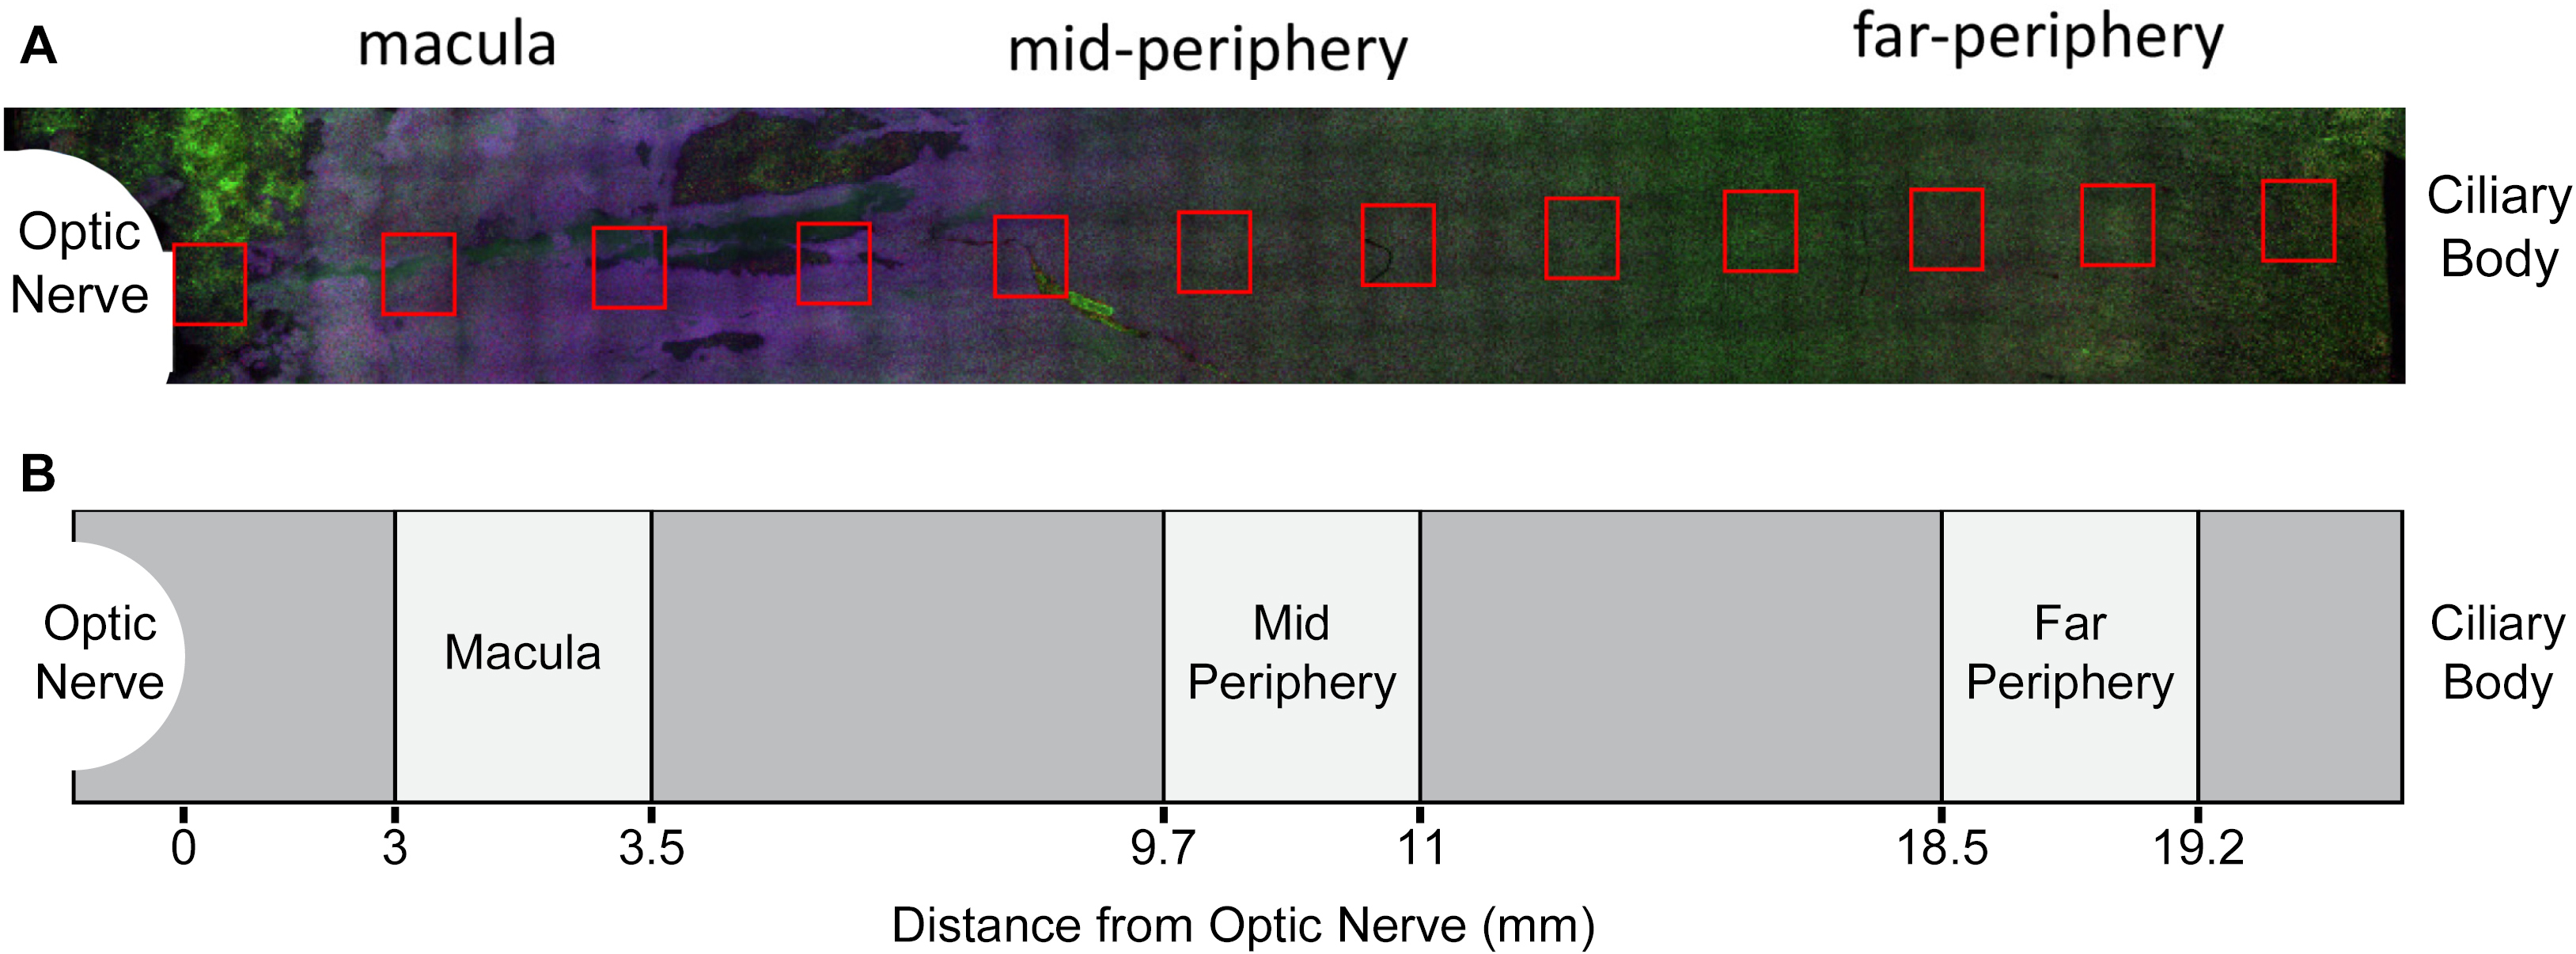
 Figure 2 of
Bhatia, Mol Vis 2016; 22:898-916.
Figure 2 of
Bhatia, Mol Vis 2016; 22:898-916.