Figure 2. Chemical hypoxia induces TF, HIF-1α, and VEGF expression in ARPE-19 cells. A: Western blots show tissue factor (TF) and hypoxia-inducible factor 1-alpha (HIF-1α). B: Histogram shows the densitometric analysis of the average levels for TF and HIF-1α to glyceraldehyde 3-phosphate dehydrogenase
(GAPDH) in each group. C: The vascular endothelial growth factor (VEGF) concentrations are examined with enzyme-linked immunosorbent assay (ELISA)
at different hypoxia time points. Hypoxia significantly increased the TF, HIF-1α, and VEGF levels in the ARPE-19 cells. *p<0.05,
compared with the normal control. Results are expressed as mean ± standard deviation (SD), n = 3 in each group.
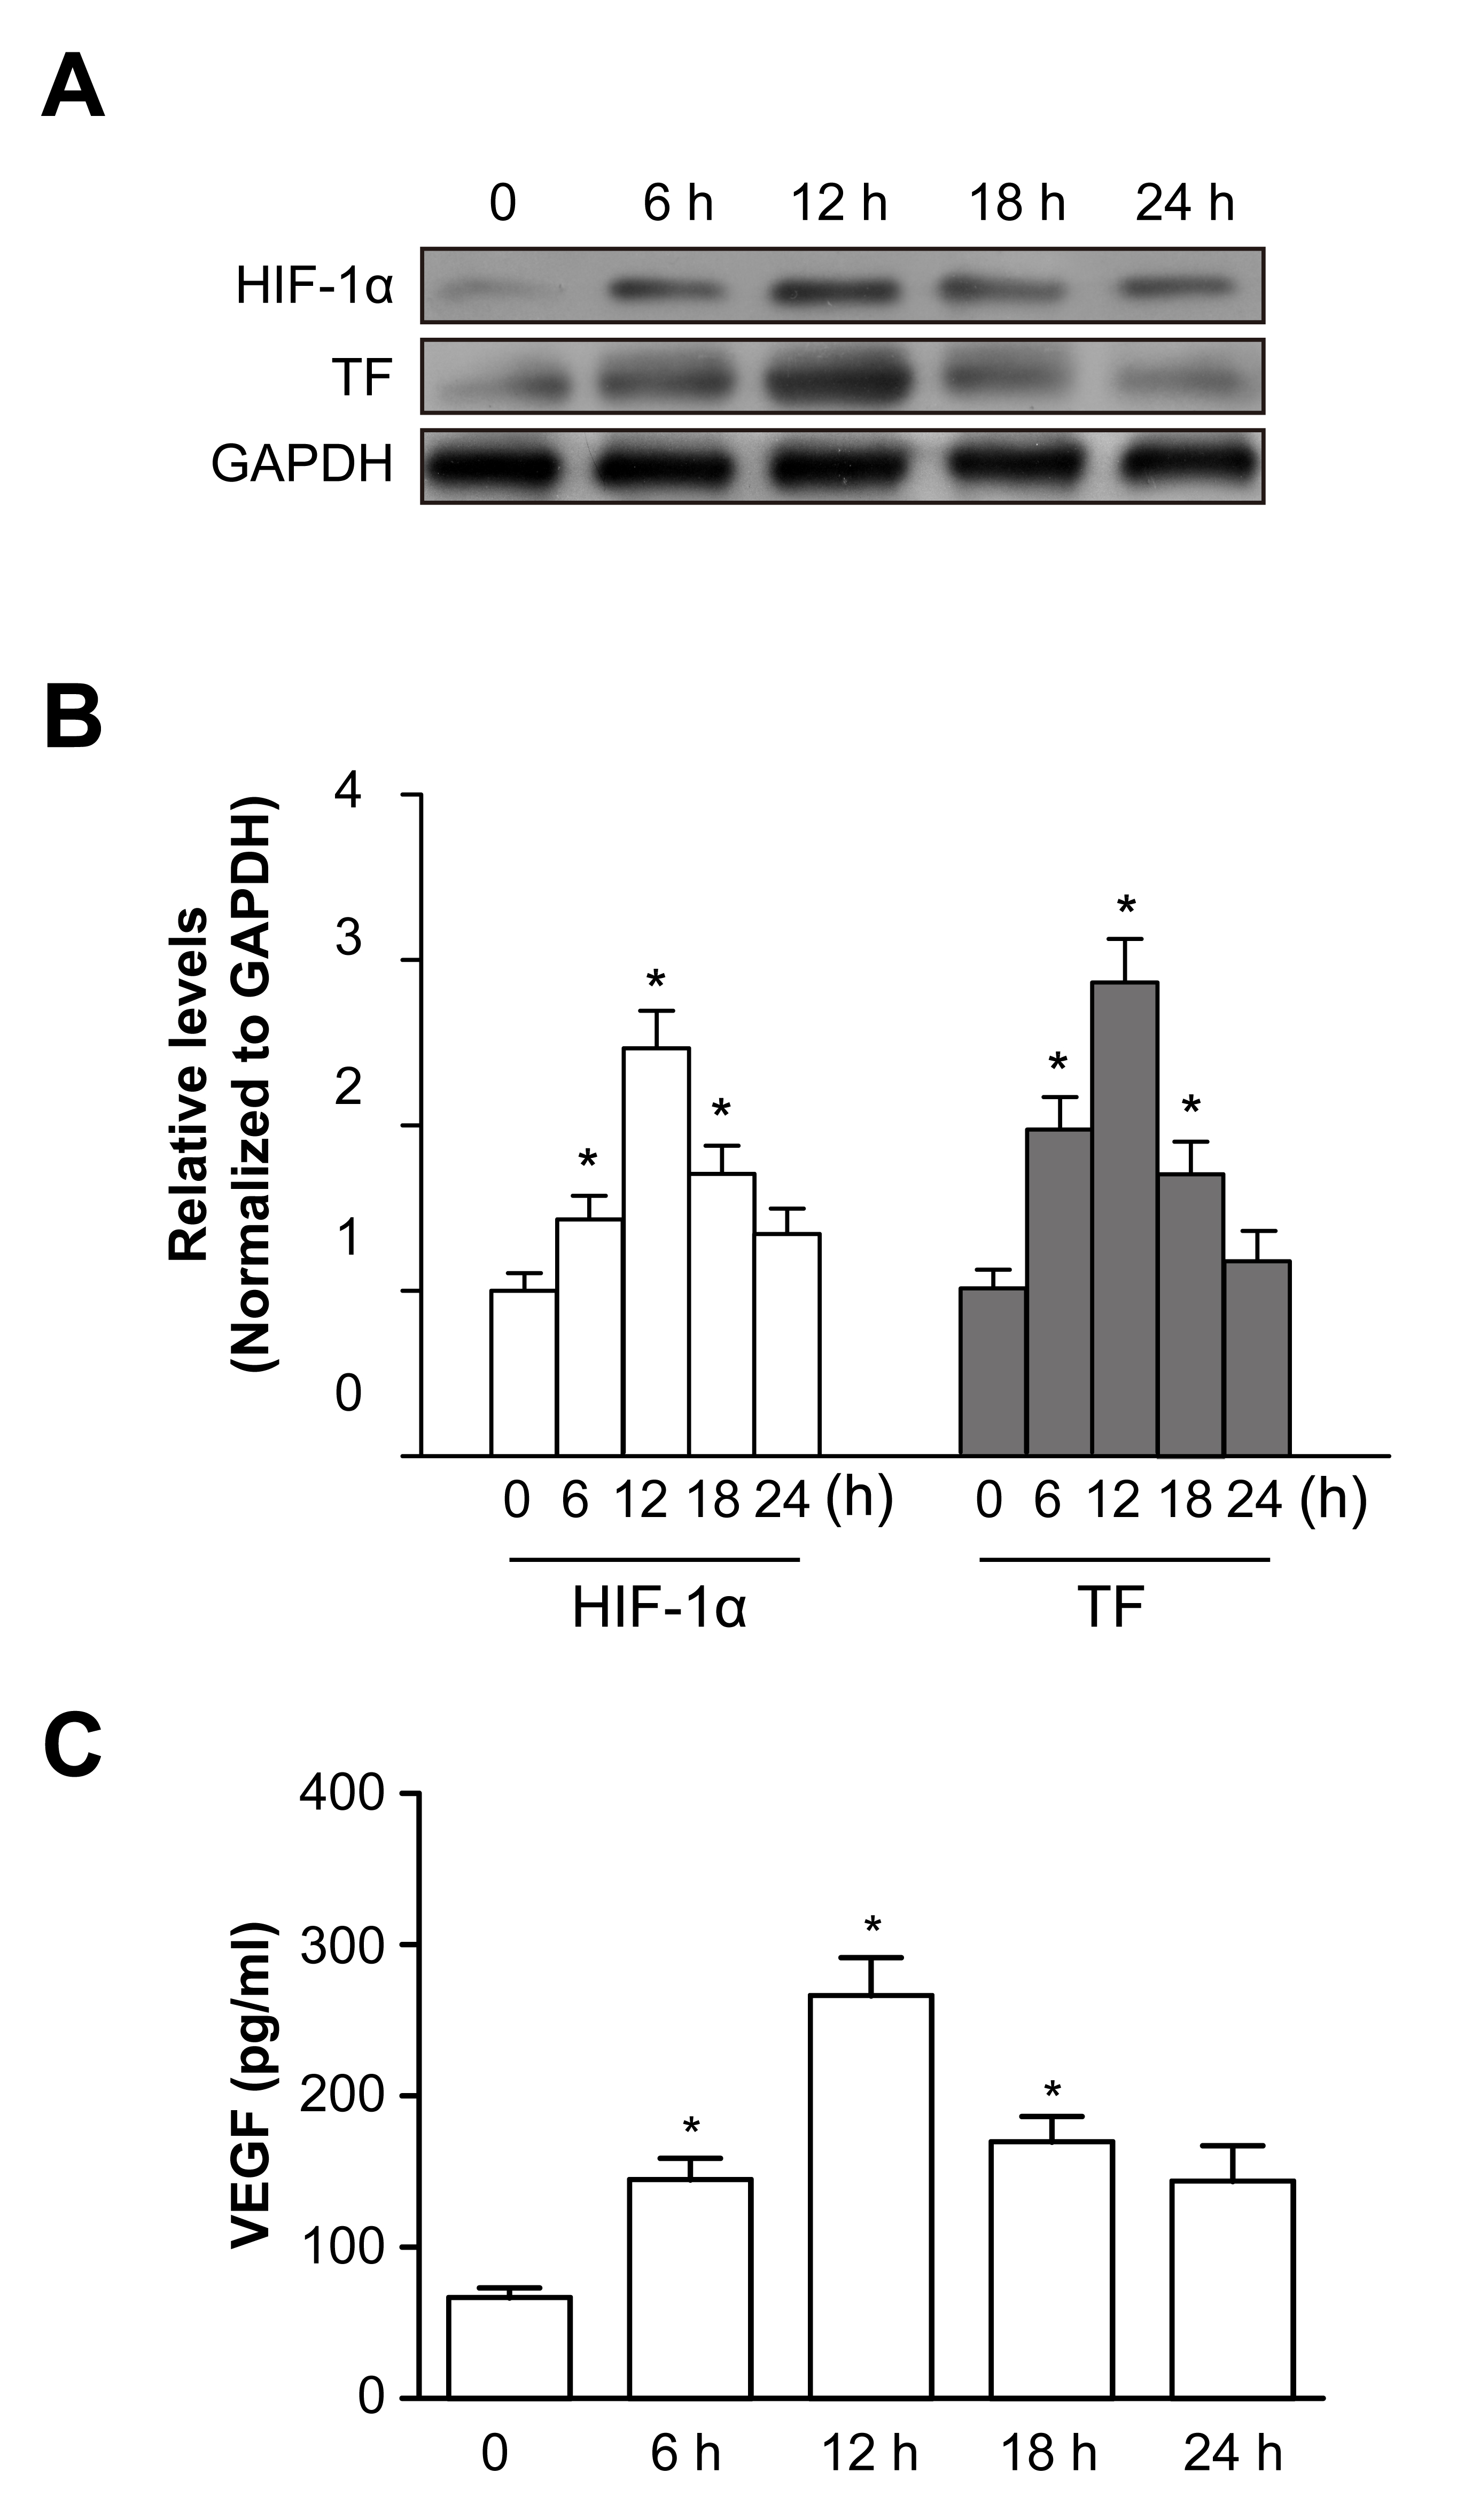
 Figure 2 of
Wang, Mol Vis 2016; 22:886-897.
Figure 2 of
Wang, Mol Vis 2016; 22:886-897.