Figure 6. Confocal images show that two functionally distinct isozymes of pyruvate kinase M (PK-M1 and PK-M2) are differentially expressed
throughout the adult retina. A: PK-M1 is expressed in all retinal neurons and synapses. B: High-magnification image of the outer retina immunolabeled for PK-M1. C: PK-M1 and COX IV colocalize (yellow-orange pixels) in the rod and cone IS and in cone perinuclear mitochondria (white arrowheads).
D: High-magnification image of the outer retina from neural retina leucine zipper–green fluorescent protein (Nrl-GFP) transgenic mice (pseudocolored in red). E: PK-M1 is expressed in the rods (yellow-orange pixels: colabeled with Nrl-GFP) and cones (green only pixels). F: PK-M1 and VGLUT1 colocalized in the OPL and the IPL (aquamarine pixels). G: PK-M1 weakly colocalized in PKCα-IR rod bipolar cell dendrites and somas but colocalized in the rod bipolar cell axon terminals
in the IPL-b (yellow-orange pixels). H: Retina triple-labeled for PK-M1, calbindin, and CHX10. PK-M1 and calbindin colocalize in horizontal cell axons in the rods
(white arrowheads) and in dendrites in the cones (white arrows) but minimally in the somas. CHX10-IR bipolar cells weakly
express PK-M1. I: PK-M2 is expressed in the OPL and the IPL. J: High-magnification image shows colocalization of PK-M2 and VGLUT1 throughout the OPL. K: High-magnification image only shows weak colocalization of PK-M2 and calbindin in horizontal cell processes. L: High-magnification image shows colocalization of PK-M2 and PKCα in the rod bipolar cell dendrites (yellow pixels: white
arrows). L: High magnification of the OPL of a retina double-labeled for PK-M2 and VGLUT1. M: PK-M2 colocalized in the PKCα-IR rod bipolar cell dendrites and axon terminals (yellow-orange pixels) but not in the somas.
COX IV = cytochrome c oxidase subunit IV, IPL = inner plexiform layer, IPL-a = IPL sublamina-a, IPL-b = sublamina-b, ISs =
inner segments, ONL = outer nuclear layer, OPL = outer plexiform layer, OSs = outer segments, PKCα-IR = protein kinase C α
immunoreactivity, VGLUT1 = vesicular glutamate transporter 1. A, F–G, and I, scale bars = 40 µm. B–E, H, and J–M, scale bars
= 20 µm.
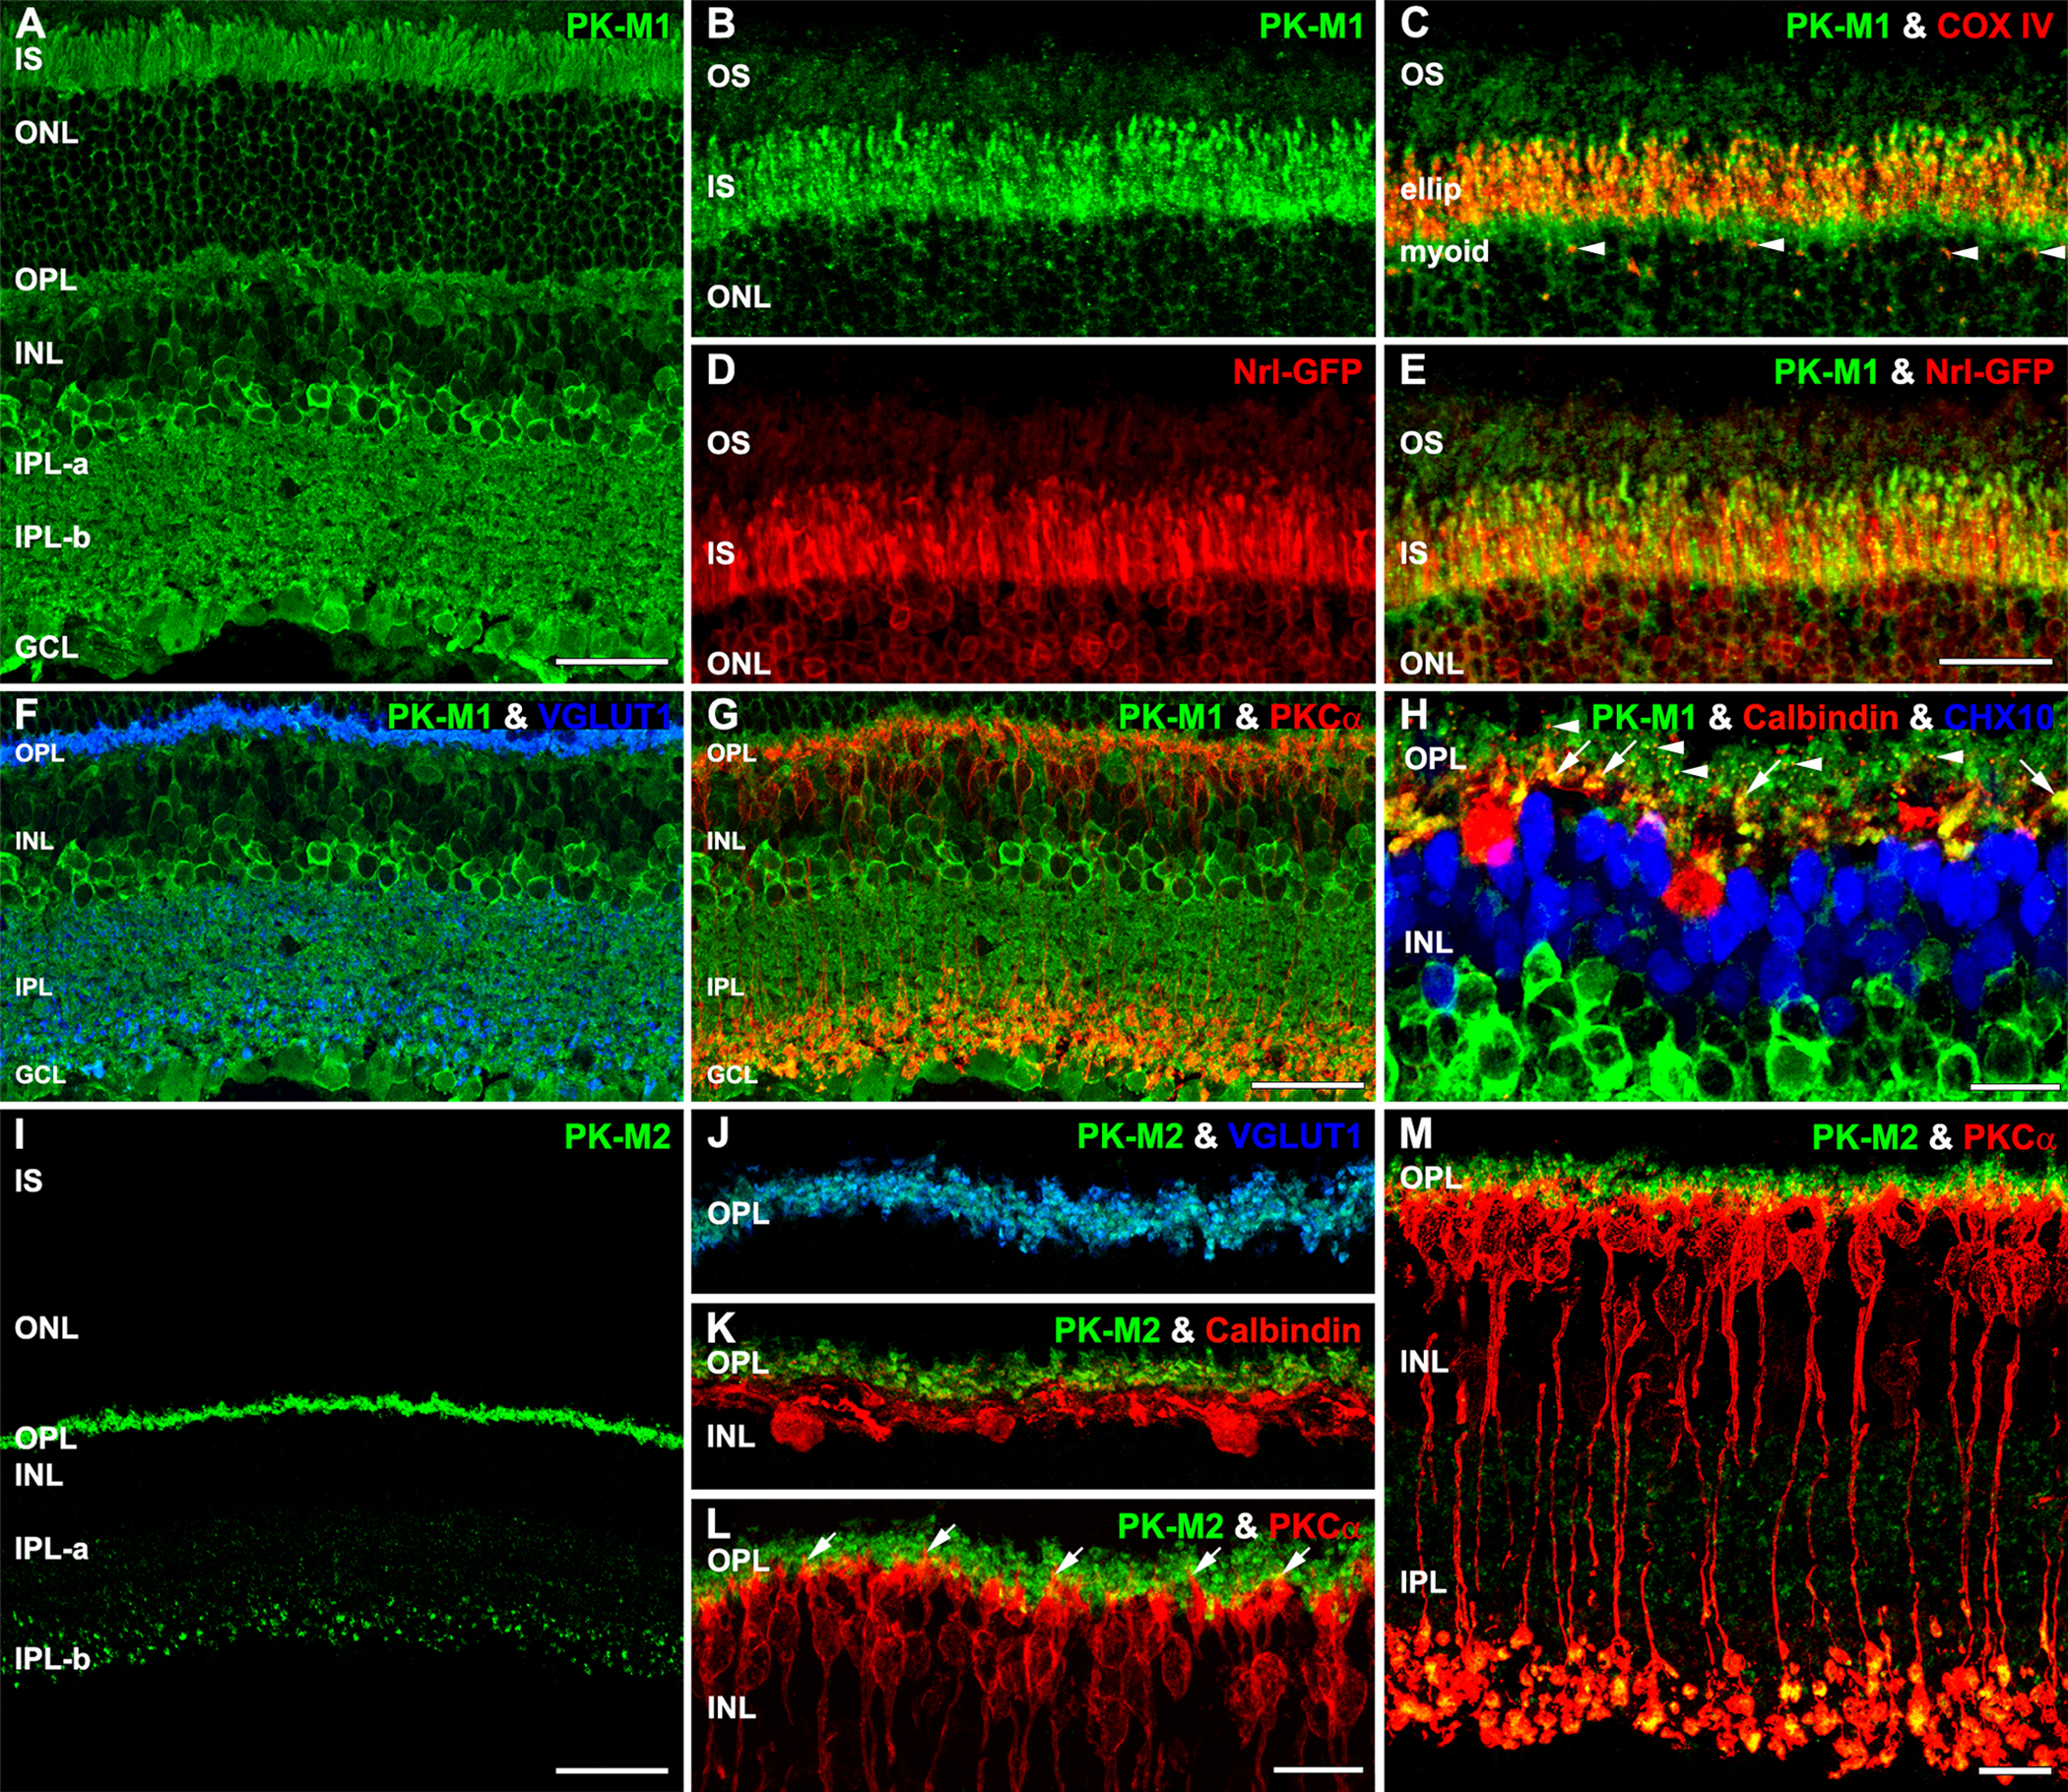
 Figure 6 of
Rueda, Mol Vis 2016; 22:847-885.
Figure 6 of
Rueda, Mol Vis 2016; 22:847-885.