Figure 2. Visual field test results obtained for the right (RE) and the left eye (LE) of two patients (USHTF1IV5, USHTF4II3). A: Result of measurements of the visual fields. B: Result of eye fundus measurement. A series of random lights of different intensities were flashed in the peripheral field
of vision of both patients. When they perceived the computer-generated light that suddenly appeared in their field of view,
they pressed a button to indicate their responses, and then we saw this spot (Dot see). If the patient was unable to see the
light in an appropriate portion of his field of view, then we saw on the computer a spot (Dot don’t see) indicating vision
loss. In all patients, the nasal and temporal fields were not preserved, and only the central field was maintained. Fundus
ophthalmoscopy showed pigmentary anomalies typical of retinitis pigmentosa (RP), attenuated arteriolar vessels and increased
brightness of the internal limiting membrane. The visual field showed an anular scotoma reduced by 15°. C: Ganzfeld-Electroretinogram of the right and left eyes of two patients (USHTF1IV5, USHTF4II3). The electroretinogram (ERG)
and the visual-evoked potential (VEP) test the function of the visual pathway from the retina (ERG) to the occipital cortex
(VEP). These tests were conducted by placing a standard ERG device attached to the skin on 2 mm above the orbit. VEPs were
recorded simultaneously from the electrode attached to the occipital scalp 2 mm above the region on the midsagittal plane.
An electrode placed on the forehead provided a ground. The results are directly related to the part of a visual field that
might be defective. This is based on the anatomic relationship of the retinal images and the visual field. After dark adaptation
for 30 min, the doctor placed anesthetic drops in the patient’s eye and placed a contact lens on the surface of the eye. Once
the contact lens was in place, a series of blue, red, and white lights were shown to the patient. The VEP is an evoked electrophysiological
potential that can be extracted, using signal averaging, from the electroencephalographic activity recorded at the scalp.
ERG and VEP were differentially amplified band pass filtered (0,1,30 Hz), recorded over 300 ms epochs, and the signals averaged.
Two trials were given. The visual evoked potential to flash stimulation consists of a series of negative and positive waves.
The earliest detectable response has a peak latency of approximately 30 ms post-stimulus. For the flash VEP, the most robust
components are the N2 (negative) and P2 (positive) peaks. Measurements of the P2 amplitude should be made from the positive
P2 peak at around 207.3 ms. The ERG recorded in BT189 showed an absence of responses although the VEP showed a normal responses
in both eyes. These traces confirm evidence of significant bilateral global retinal degeneration. Only cone flicker responses
of less than 15% of the normal mean were recordable under photopic conditions while all other responses were below noise level,
a typical finding for patients with retinitis pigmentosa.
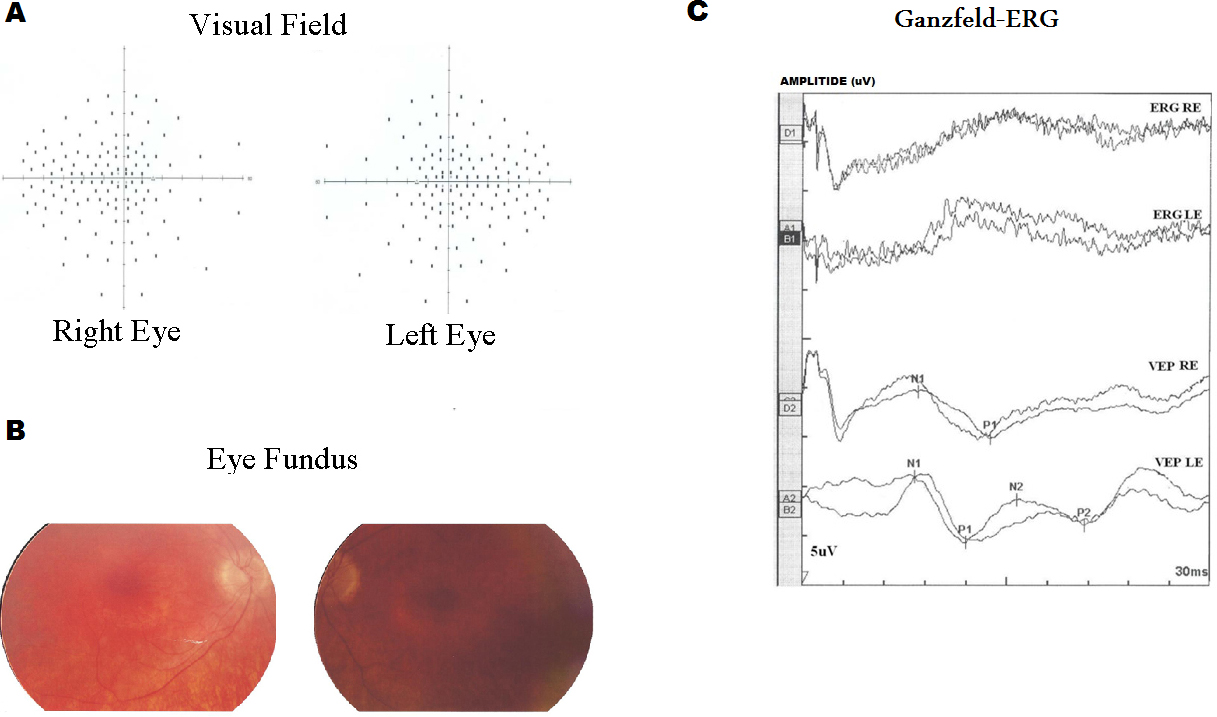
 Figure 2 of
Ben-Rebeh, Mol Vis 2016; 22:827-835.
Figure 2 of
Ben-Rebeh, Mol Vis 2016; 22:827-835.