Figure 1. Protein expression changes after 1 week of experimental glaucoma. Immunoblot intensity ratios of experimental glaucoma at
1 week for four selected proteins, with significant elevations in three molecules and all near or greater than twofold increase.
Mean ± standard error. Asterisk indicates p value <0.05 for significant increase in glaucoma compared to the control eyes,
each referenced to the glyceraldehyde-3-phosphate dehydrogenase (GAPDH) value from the blot; t test or Wilcoxon rank-sum test.
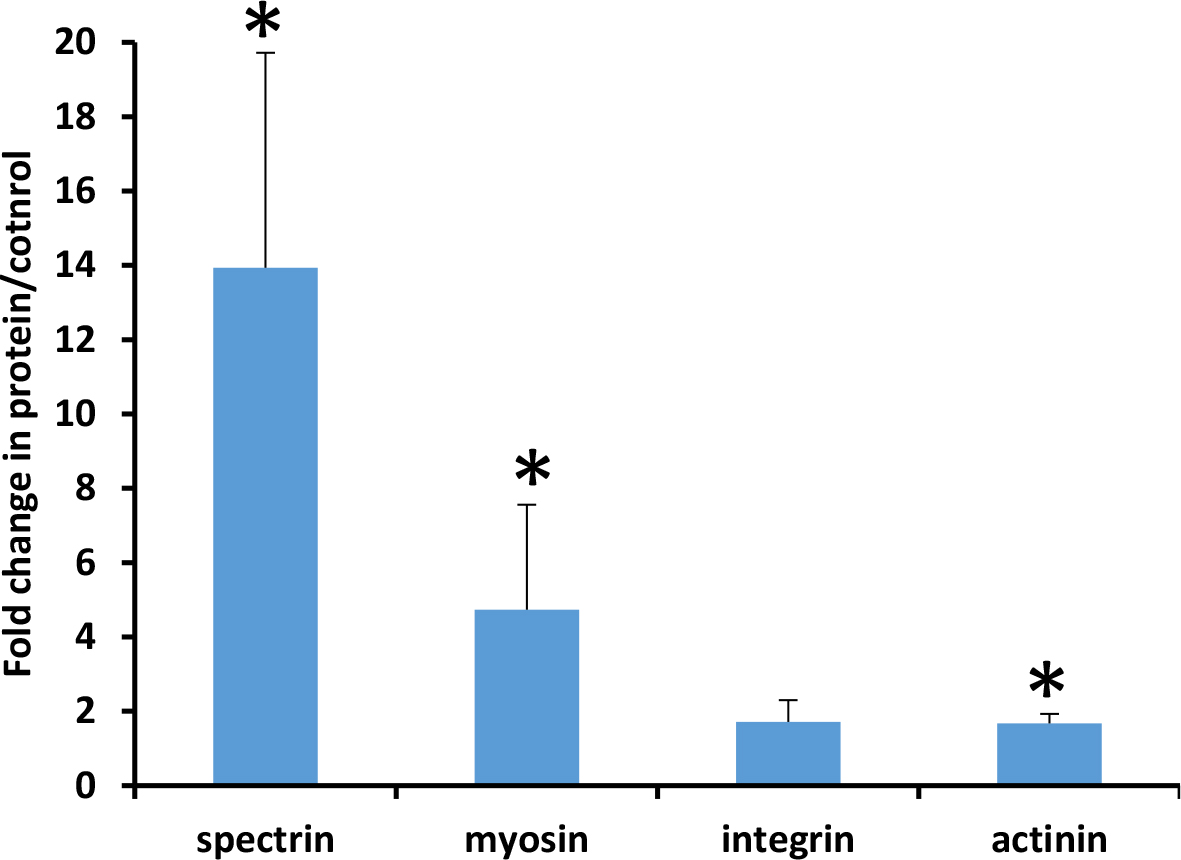
 Figure 1 of
Oglesby, Mol Vis 2016; 22:82-99.
Figure 1 of
Oglesby, Mol Vis 2016; 22:82-99.