Figure 5. Comparison of the residue interactions between R52 and residue 57 in the WT and in the mutant. Ribbon diagrams of the wild-type
(A) and mutant (B) models, viewed from the standard perspective, with the C-terminal domain on the right side. The calculated interaction energies
between residues R52 and G57 or W57 are shown in the insets
.
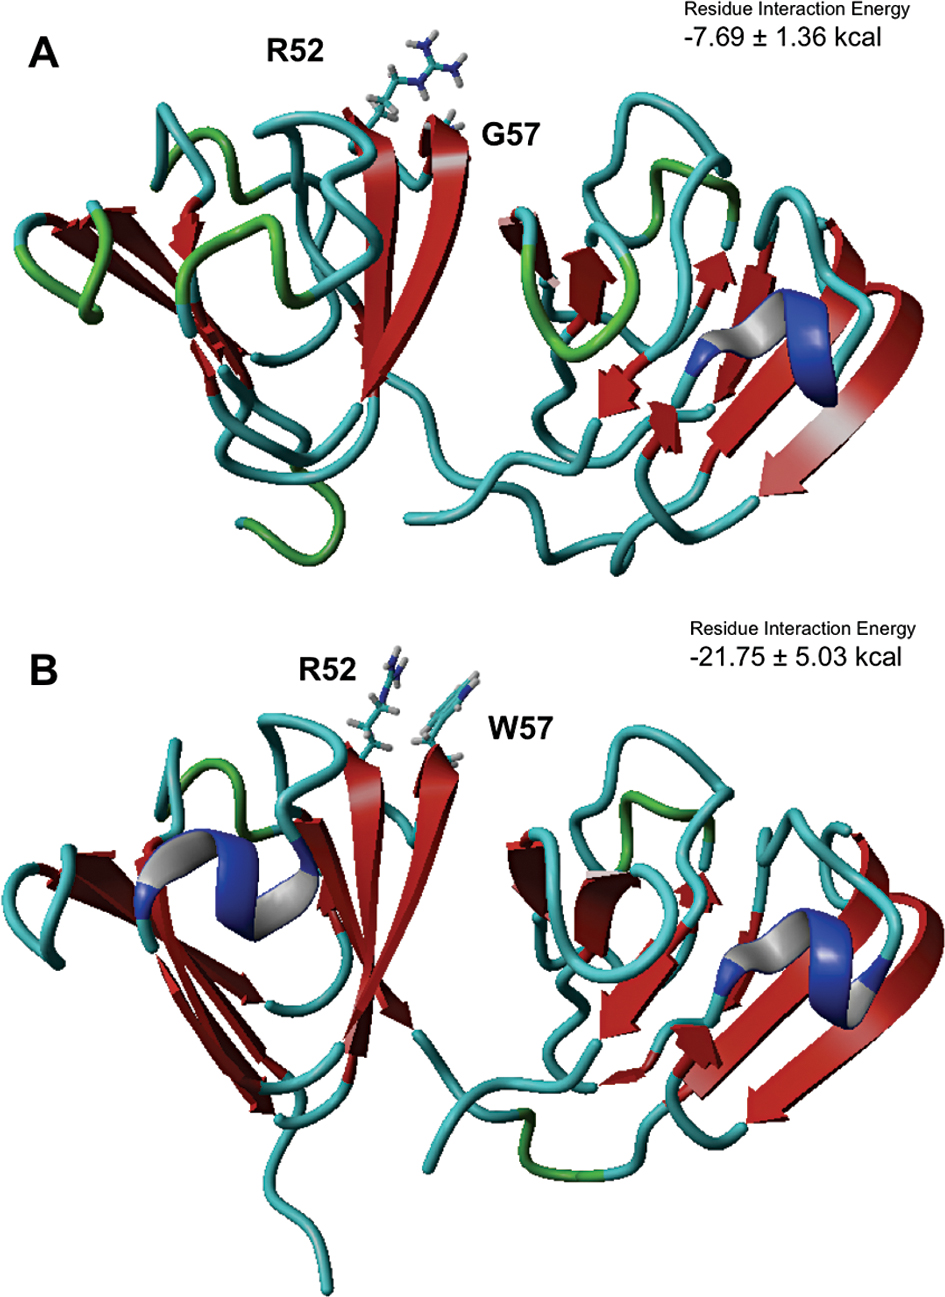
 Figure 5 of
Khan, Mol Vis 2016; 22:771-782.
Figure 5 of
Khan, Mol Vis 2016; 22:771-782.