Figure 3. The mutant is less stable as seen by thermal and chemical denaturation and tends to aggregate producing light-scattering particles.
A: The mutant G57W denatures at a lower temperature than the wild-type (WT) CrygS. The circular dichroism (CD) spectrum of
each protein was measured at a wavelength of 222 nm, as a function of increasing temperature (290–360 K), and the data were
fitted using the two-state model. The protein concentration in each case was 0.2 mg/ml in 10 mM sodium phosphate buffer (pH
7.3). The cell path length was 2 mm, and all spectra were corrected for background buffer signal. Each spectrum is an average
of three independent runs. B: Guanidinium chloride–induced denaturation of wild-type and G57W CrygS. The relative emission intensity of the 360 nm band
(of the denatured form) was compared to that of the 320 nm band (of the WT protein) and monitored as a function of denaturant
concentration. λexc in each case was 295 nm. The protein concentration in each sample was fixed at 0.2 mg/ml in 50 mM Tris buffer, 1 mM EDTA,
and 5 mM dithiothreitol (DTT). The cell path length was 3 mm, the excitation and emission slits were 5 nm, and the spectra
were recorded at 27 °C. The spectrum shown is the average of three runs. C: Thermal aggregation of WT and G57W CrygS at two different temperatures. Light scattering was measured at 600 nm for 1800
s at 55 °C and 60 °C. The protein concentration was 0.2 mg/ml in 50 mM Tris buffer, the cell path length was 10 mm, the excitation
and emission slits were 5 nm, and the spectra were recorded at 27 °C.
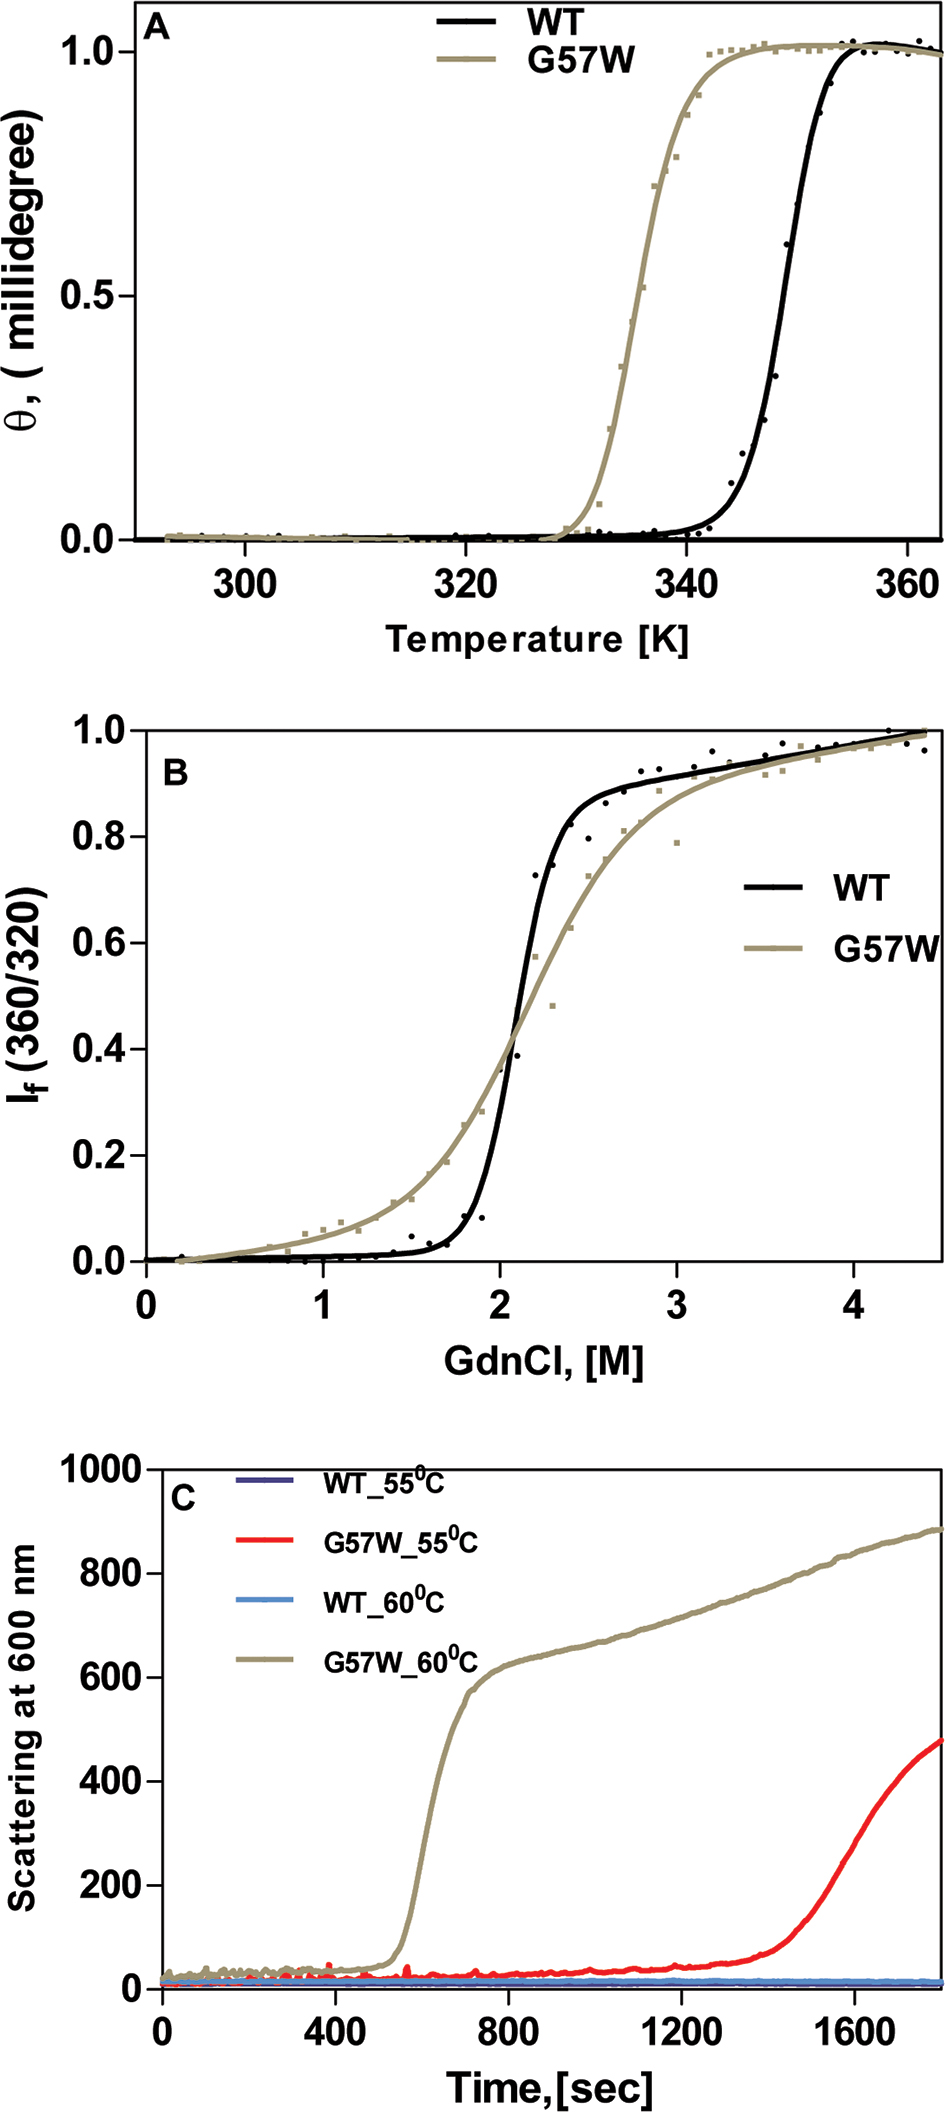
 Figure 3 of
Khan, Mol Vis 2016; 22:771-782.
Figure 3 of
Khan, Mol Vis 2016; 22:771-782.