Figure 2. Immunocytochemistry for GLUT1 in RPE cells. D407 cells were cultured with different concentrations of glucose and subjected
to hypoxia and normoxia. Staining for GLUT1 (red) shows higher intensity in the cell membrane of cells subjected to hypoxia.
4',6-diamidino-2-phenylindole (DAPI; blue) represents the nuclei. Magnification = 630X, scale bar = 20 µM.
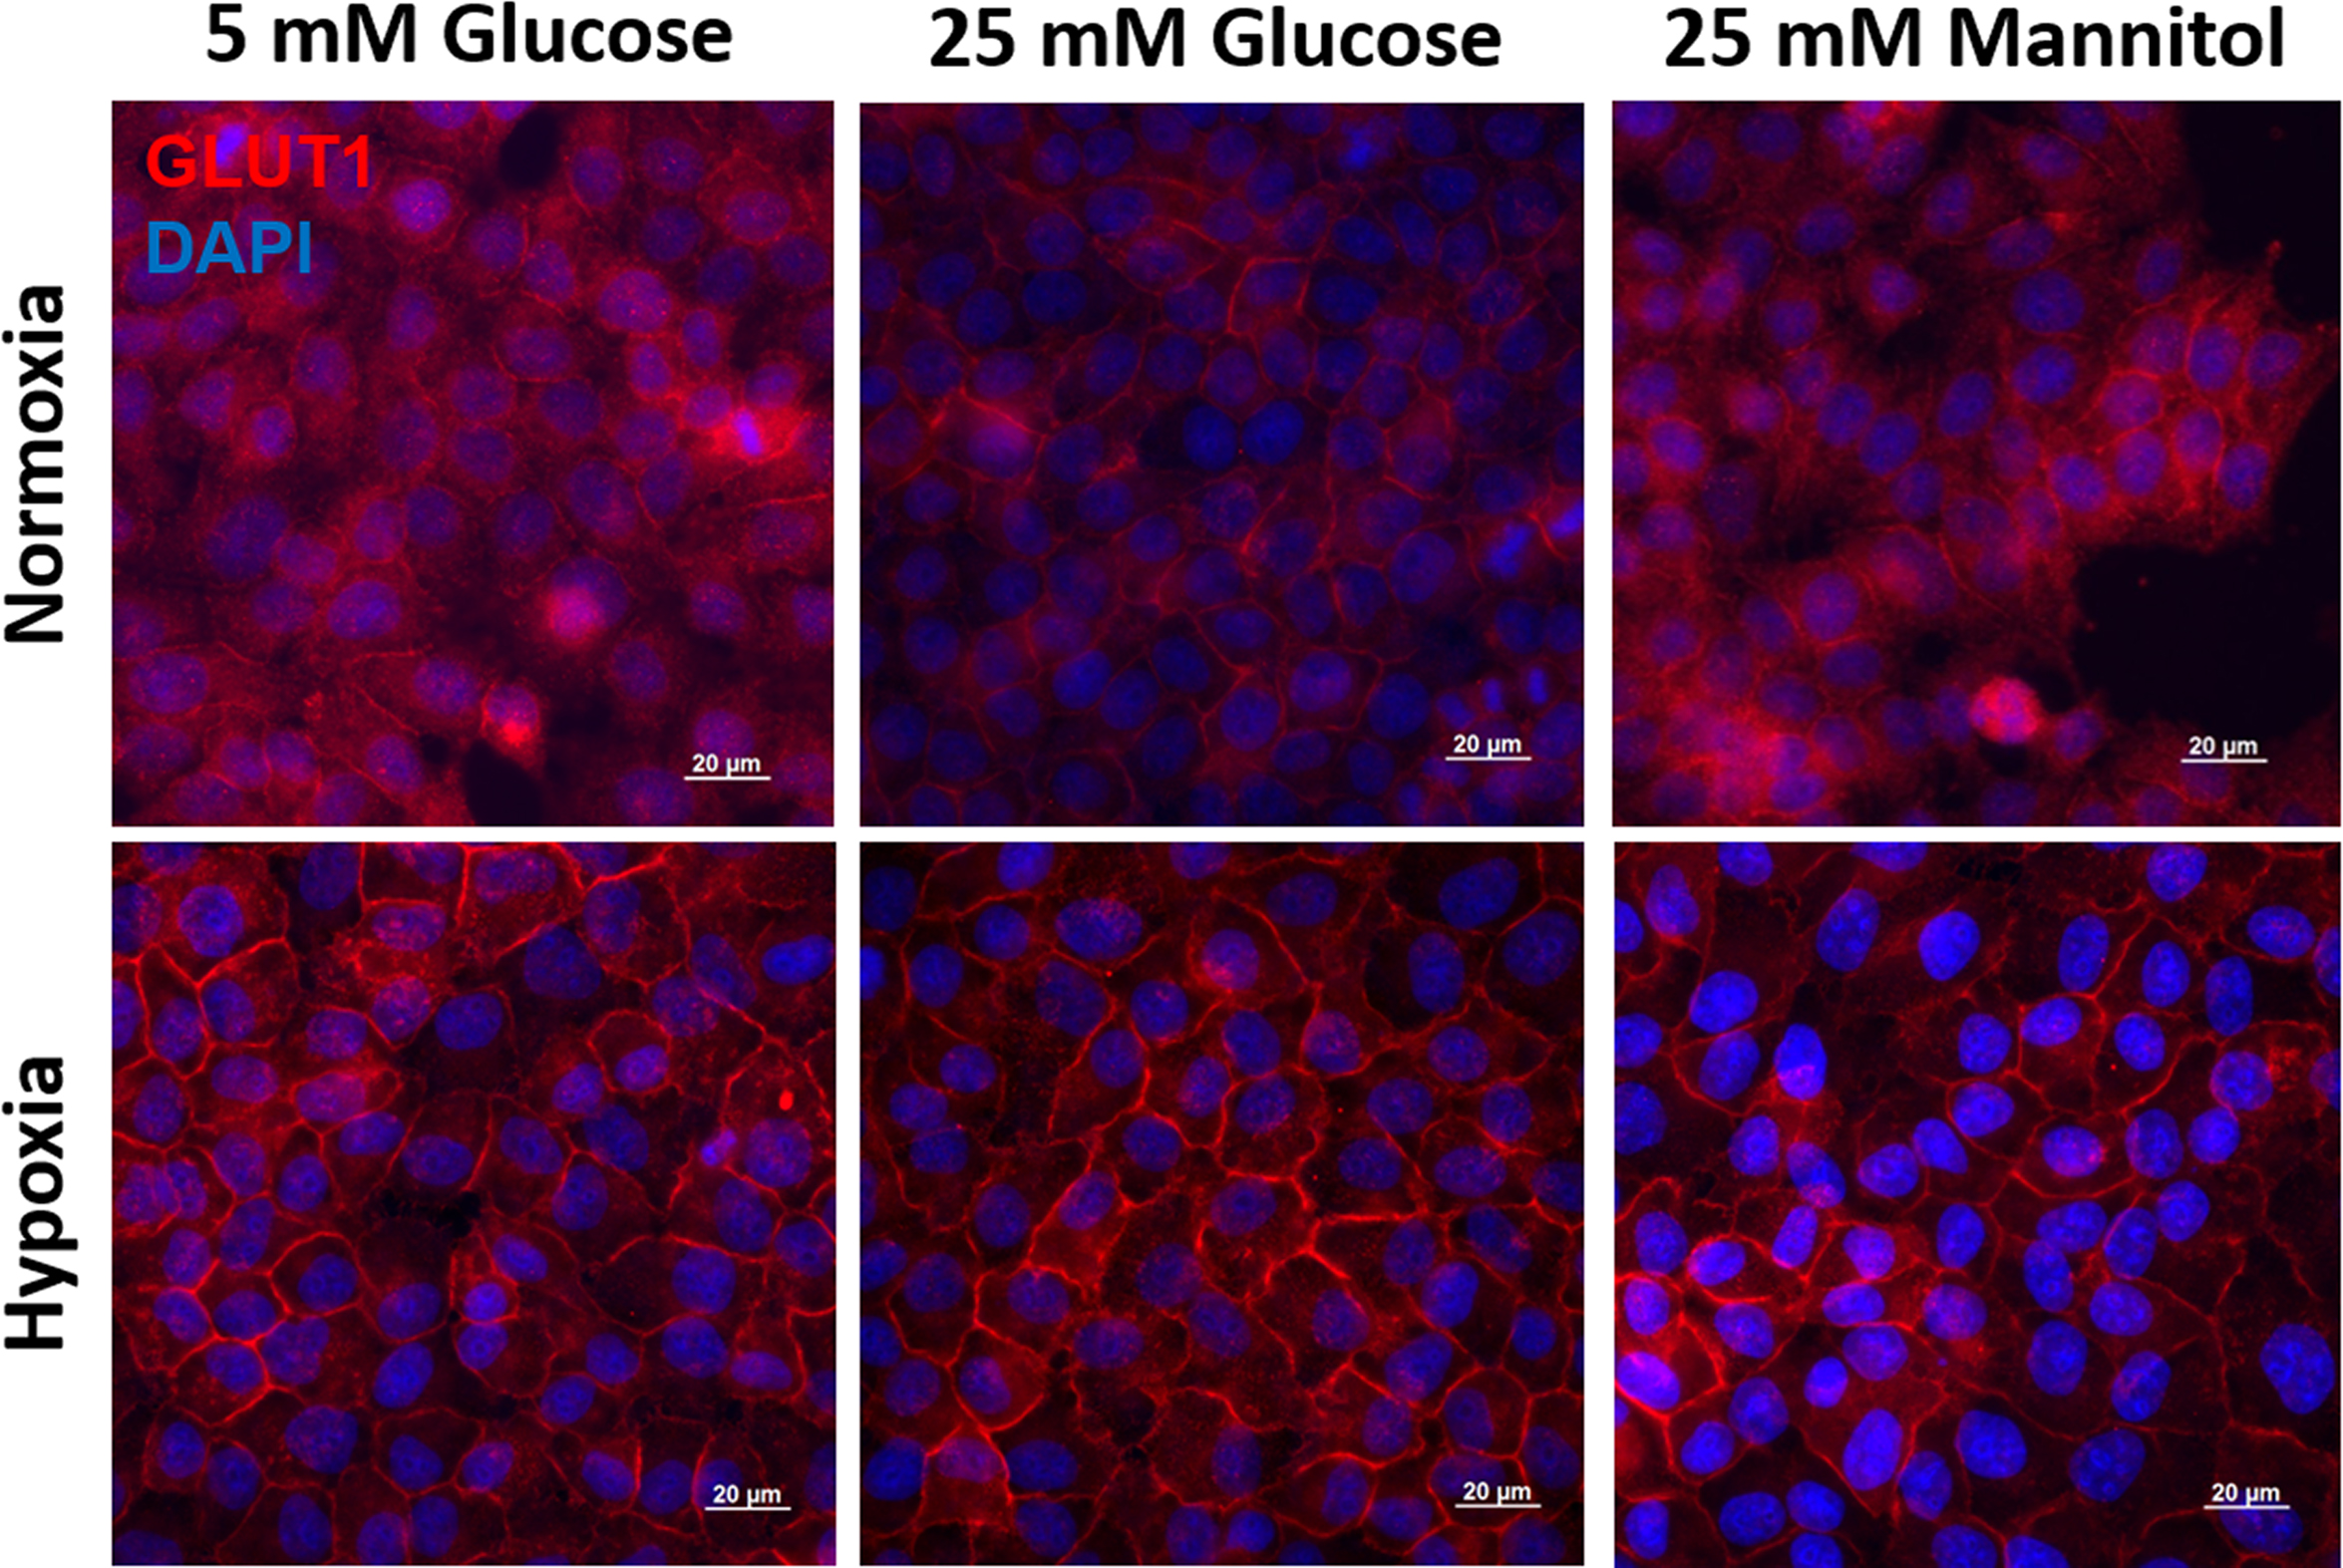
 Figure 2 of
Calado, Mol Vis 2016; 22:761-770.
Figure 2 of
Calado, Mol Vis 2016; 22:761-770.