Figure 1. Effect of glucose and hypoxia on GLUT1 expression. Western blot analysis of GLUT1 in D407 RPE cells cultured under normoxia
(N) and hypoxia (H) conditions and different concentrations of glucose in the culture medium: 5 mM of D-glucose (corresponding
to normoglycemia), 25 mM of D-glucose (corresponding to hyperglycemia), and 25 mM of mannitol (osmolarity control). Quantitative
data were obtained by normalization with β-actin bands. n = 4. *p<0.05 represents a significant difference in GLUT1 levels
in cells cultured under hypoxia with high glucose concentration medium, determined with Tukey’s multiple comparisons test.
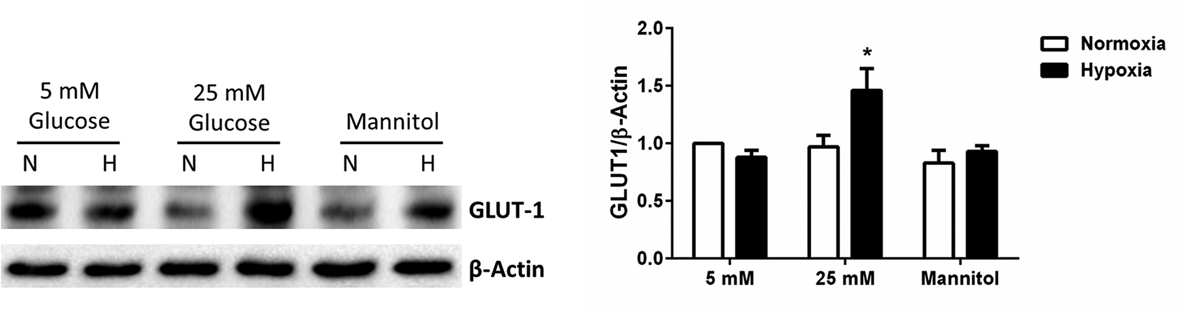
 Figure 1 of
Calado, Mol Vis 2016; 22:761-770.
Figure 1 of
Calado, Mol Vis 2016; 22:761-770.