Figure 7. Assessment of multiple injections of RS1-expressing MSCs at P120. A: The total schisis areas from four quadrants were calculated and compared among three groups. B: Number of photoreceptor nuclei in the outer nuclear layer (ONL). C: A- and b-wave measurements from scotopic electroretinogram (ERG). D: Spatial frequency thresholds (cycles per degree) in the different treatment groups. Data are presented as the mean ± standard
error of the mean (SEM; *, p<0.05, n = 6).
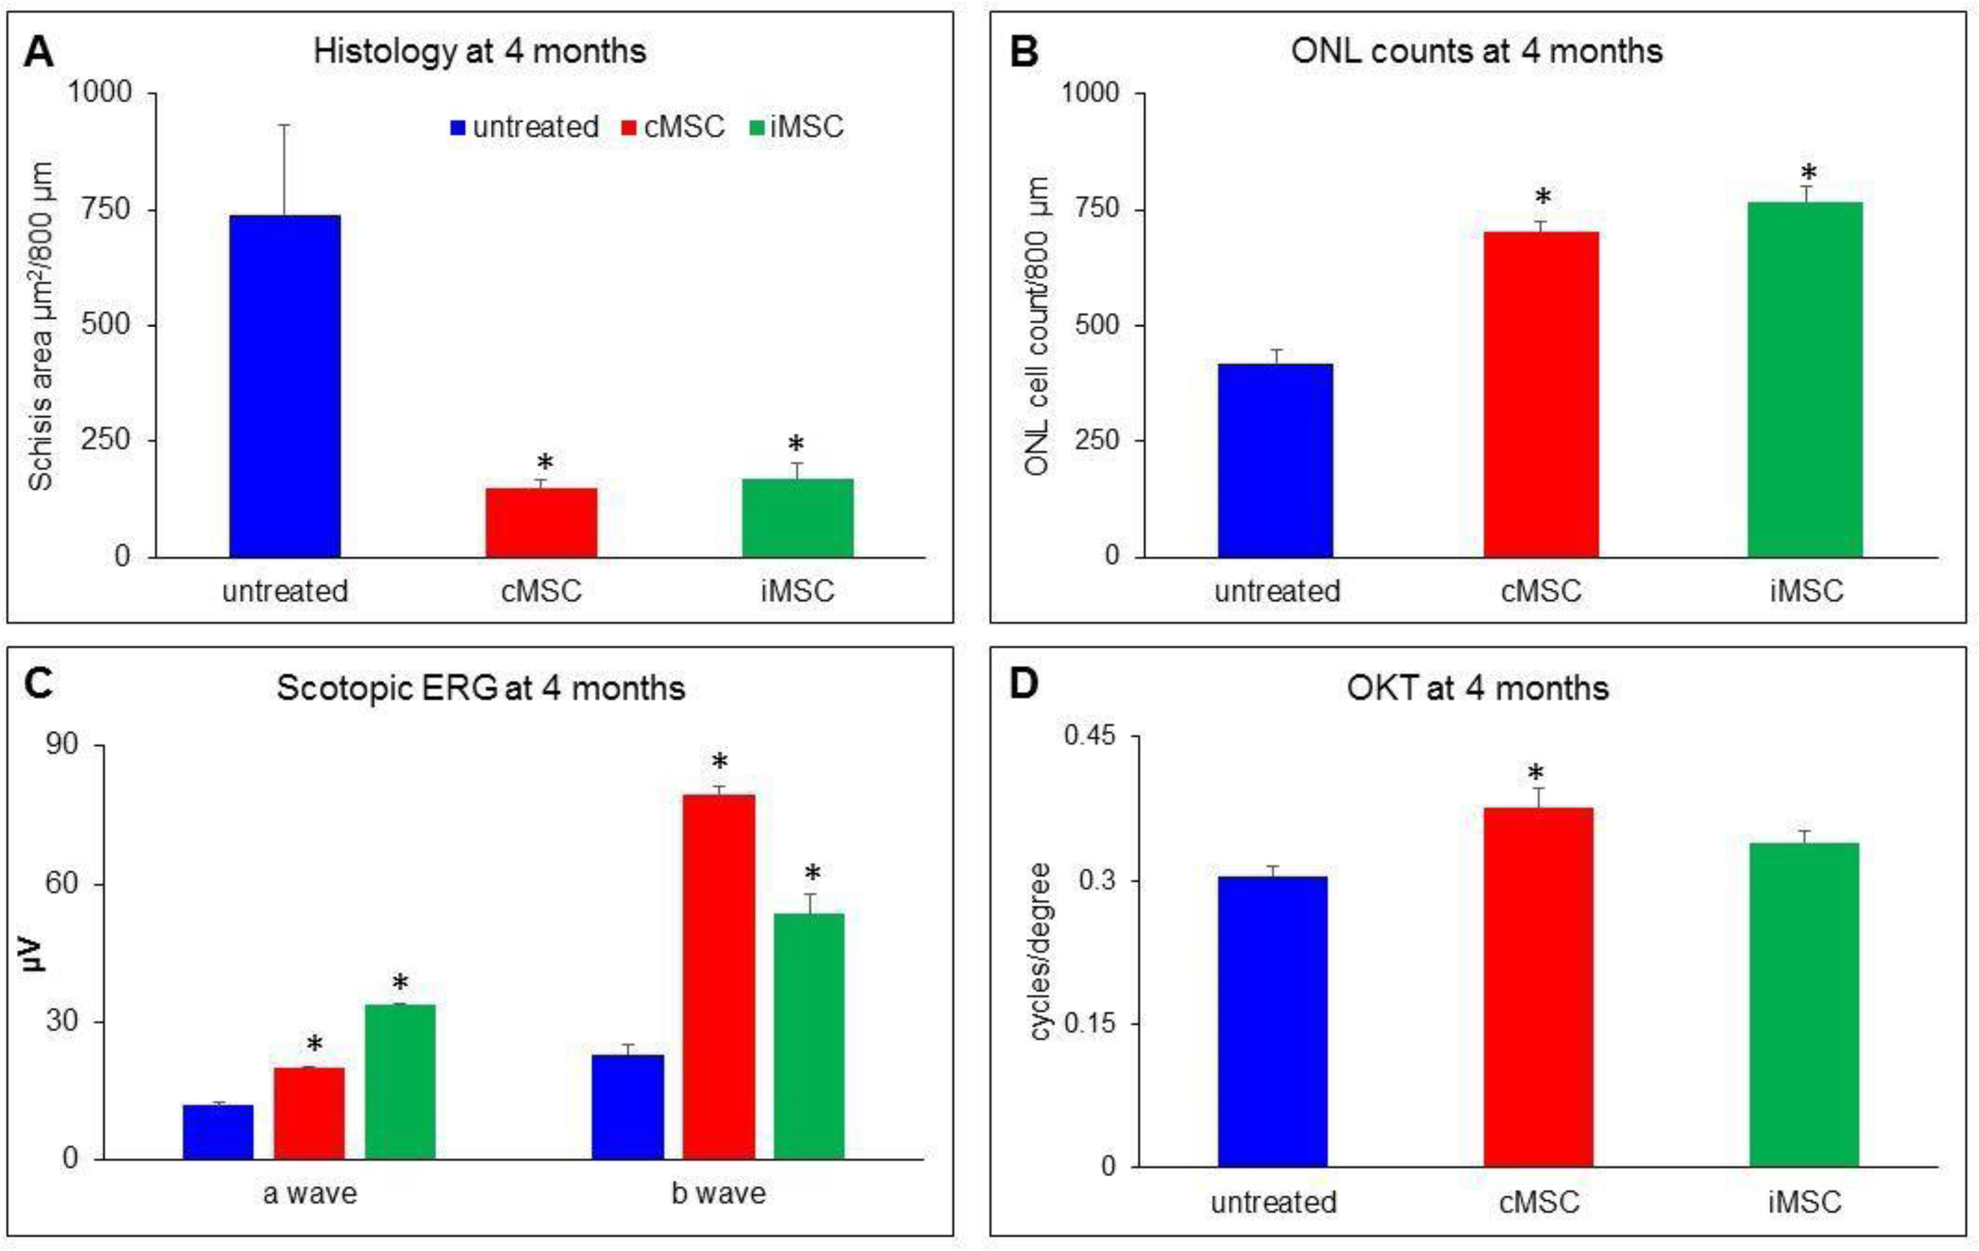
 Figure 7 of
Bashar, Mol Vis 2016; 22:718-733.
Figure 7 of
Bashar, Mol Vis 2016; 22:718-733.