Figure 6. Quantitation and localization of RS1 in the retina after multiple injections. A: The amount of RS1 in retinal lysates at P120 was compared between the untreated group and the two treated groups. The mean
of each group is presented with ± standard error of the mean (SEM). B: Representative immunohistochemical localization of the RS1 protein (red), colocalized with PDGFRα (green) expressing constitutive
mesenchymal stem cells (MSCs) and inducible MSCs in treated versus untreated eyes at P120, showing a gradient of fluorescent
staining in the inset (3X higher magnification). Nuclei are stained with Hoechst. C: Representative images of the inferior central quadrant of retina from each of the three groups. Schisis cavities indicated
by arrows. Scale bar = 50 µm.
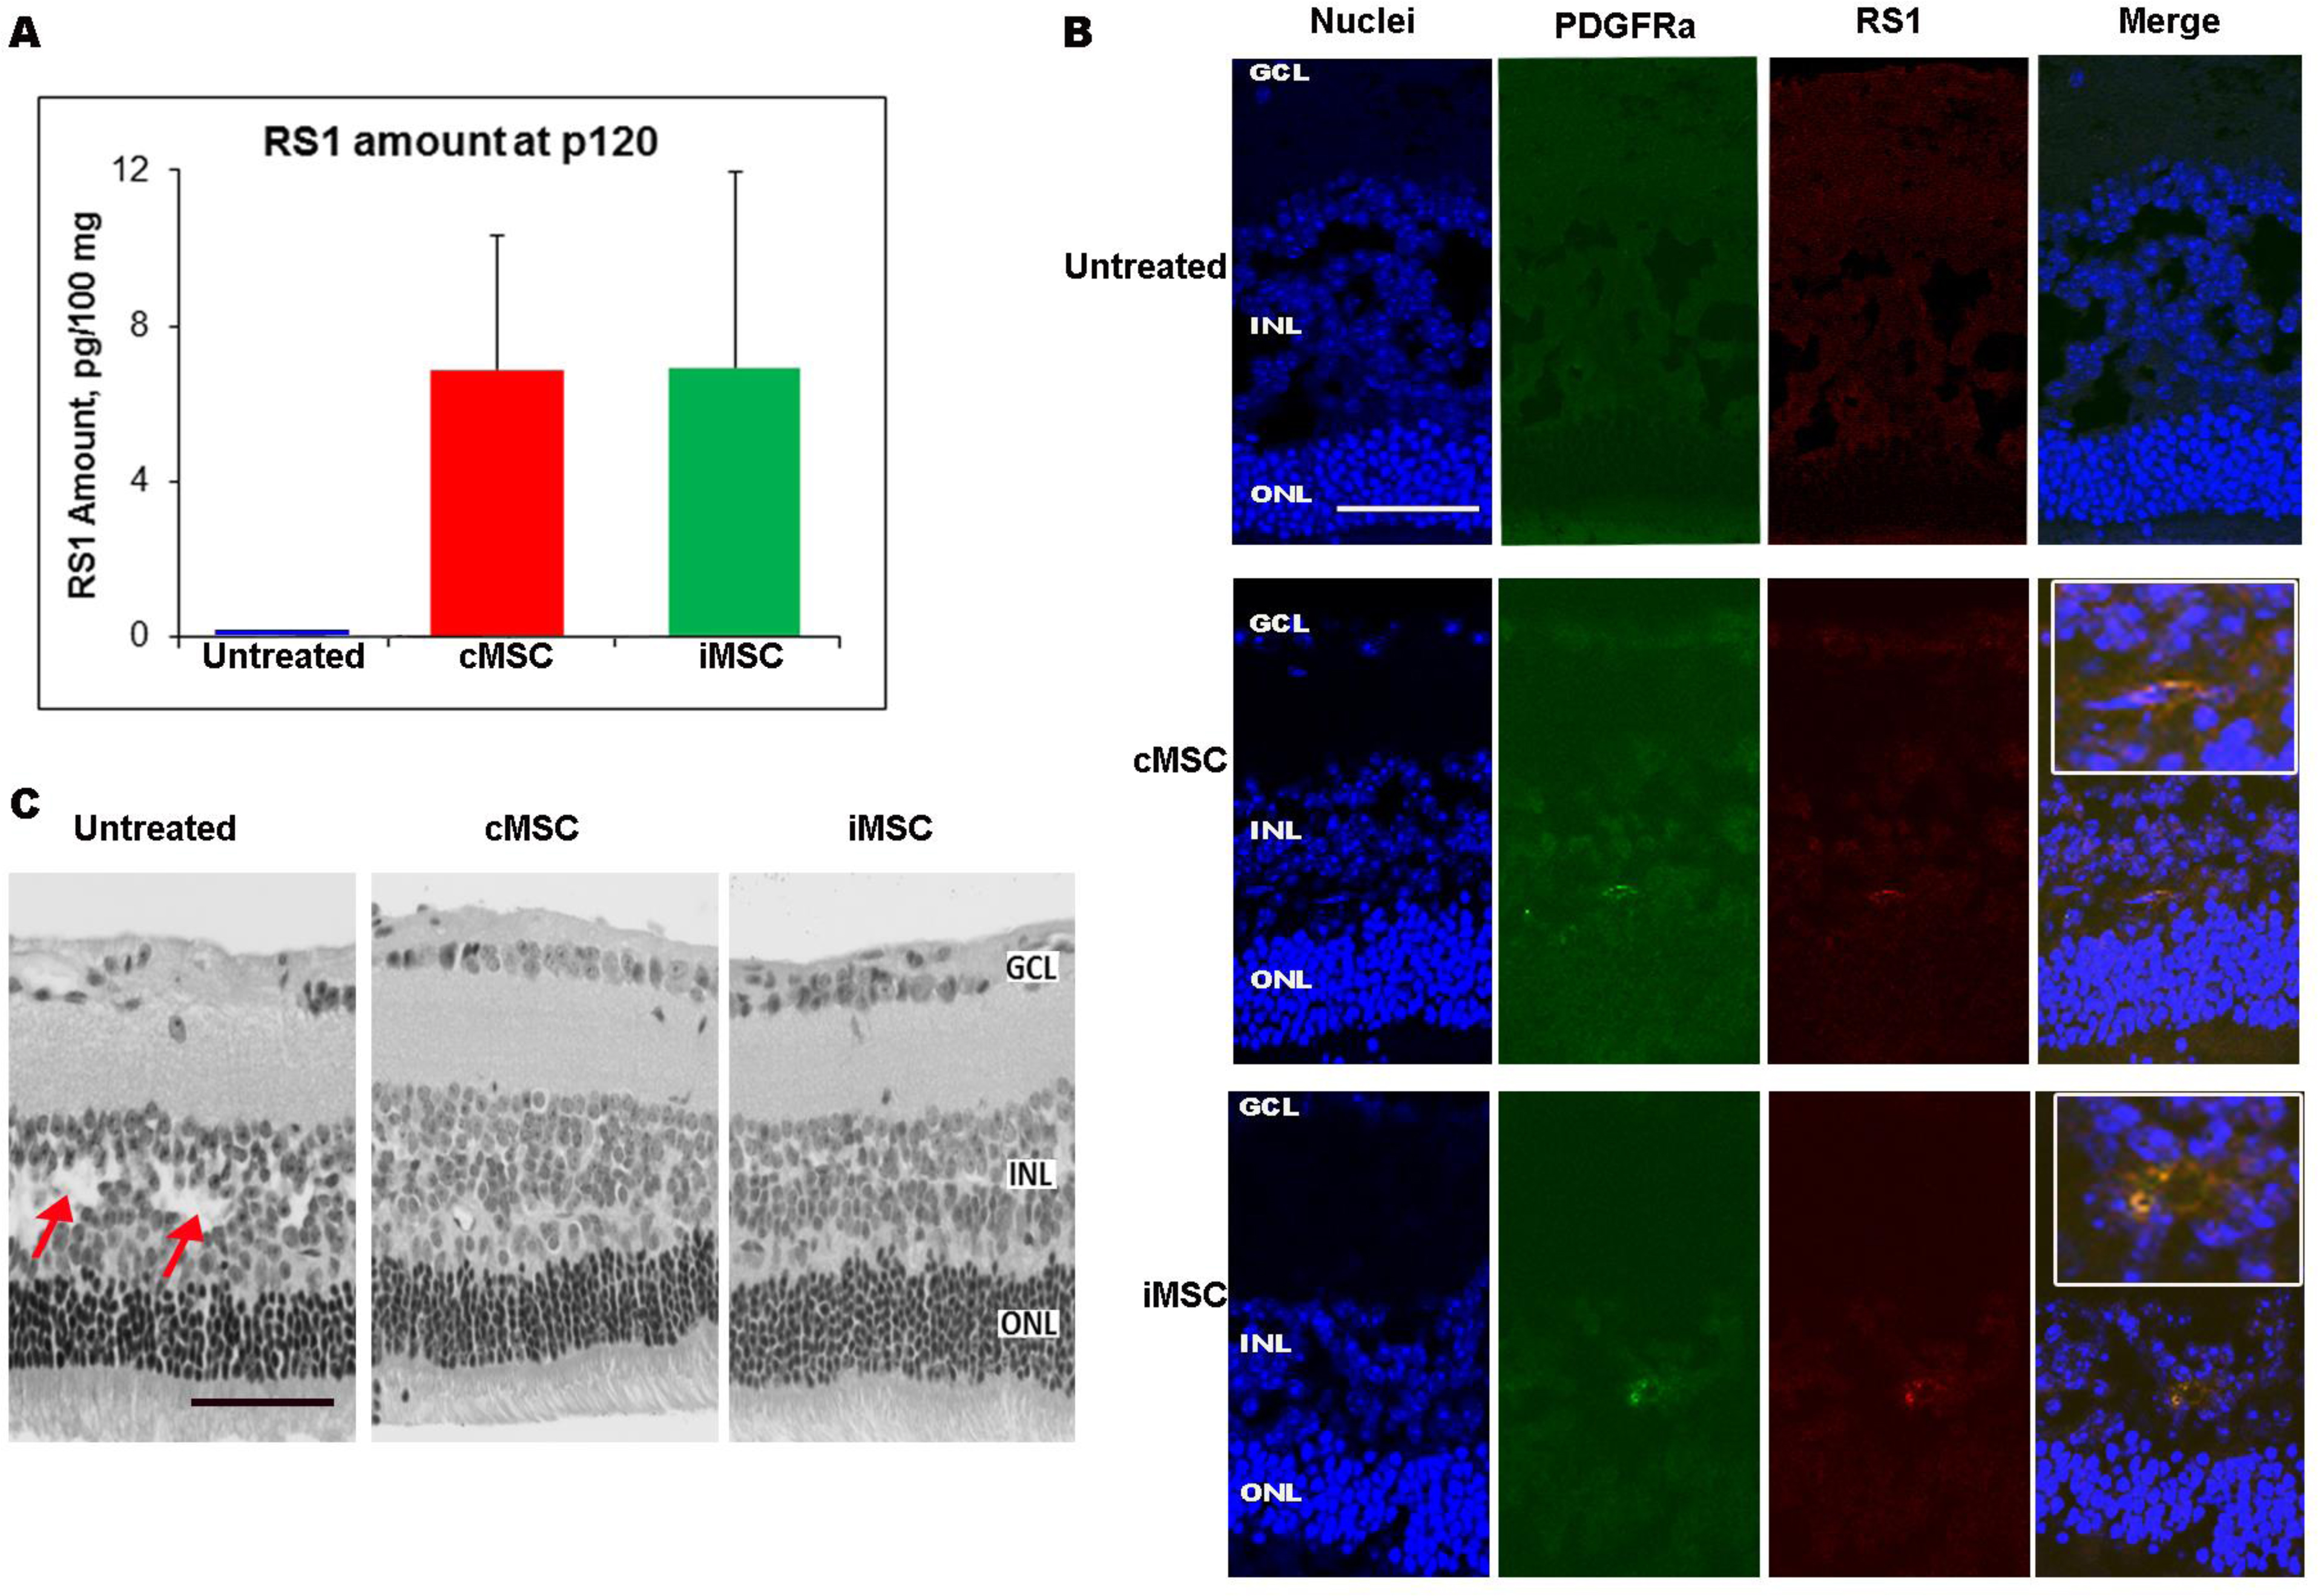
 Figure 6 of
Bashar, Mol Vis 2016; 22:718-733.
Figure 6 of
Bashar, Mol Vis 2016; 22:718-733.