Figure 4. Schisis cavity measurements after injection of constitutive MSCs and inducible MSCs. A–C: Spidergrams of three post-injection time points comparing the schisis area in the four quadrants of the retina of the five
different groups (untreated, vehicle-treated, untransfected mesenchymal stem cells [MSCs], constitutive MSCs, and inducible
MSCs). D: The total schisis area from all four quadrants was calculated and compared among the groups at all three time points. Data
are presented as mean ± standard error of the mean (SEM). IP = inferior peripheral; IC = inferior central; ONH = optic nerve
head; SC = superior central; SP = superior peripheral. *p<0.05 (n = 6).
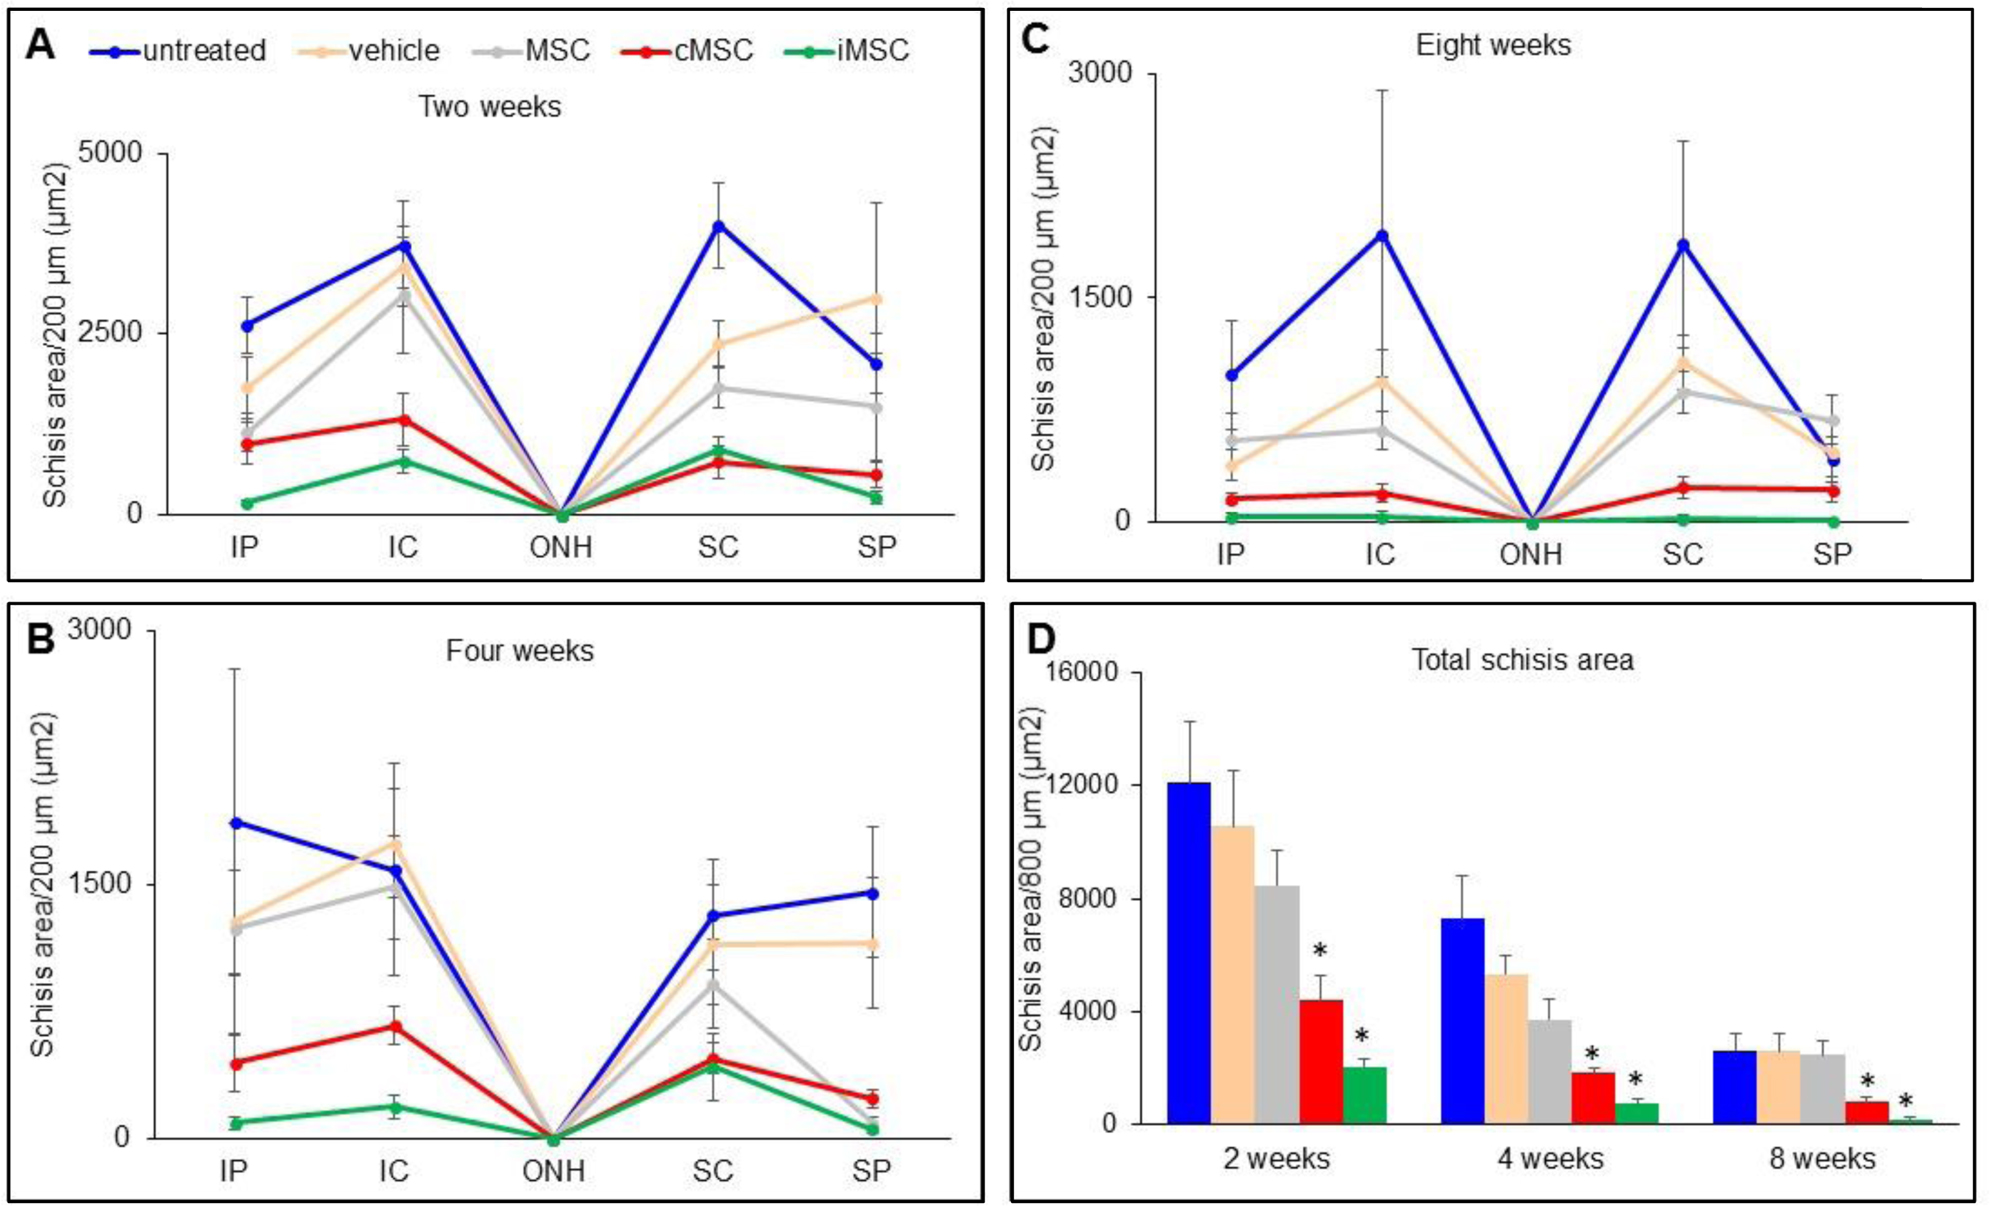
 Figure 4 of
Bashar, Mol Vis 2016; 22:718-733.
Figure 4 of
Bashar, Mol Vis 2016; 22:718-733.