Figure 1. Expression and characterization of genetically modified MSCs. A: RS1 mRNA expression (670 bp) in mesenchymal stem cells (MSCs) with a constitutive vector compared to the untransfected control
cells (adipose tissue MSCs, AMSCs). No RT, without reverse transcriptase. GAPDH (404 bp) used as loading control. B: RS1 mRNA expression in MSCs with the inducible vector (inducible MSCs). DOX = doxycycline. C: RS1 protein expression (24 kDa) in constitutive MSCs, untransfected AMSCs, and positive control Weri retinoblastoma (RB)
cells. D: RS1 protein expression in MSCs with an inducible vector (inducible MSCs). Loading control, 42 kDa β-actin. E: Cytosolic RS1 localization (red) in constitutive MSCs and inducible MSCs, that is absent in untransfected AMSCs. Nuclei
labeled with Hoechst (blue). F: Quantification of the rate of the RS1 protein secreted in the cell culture media and expressed by constitutive MSCs and
inducible MSCs. Scale = 25 µm.
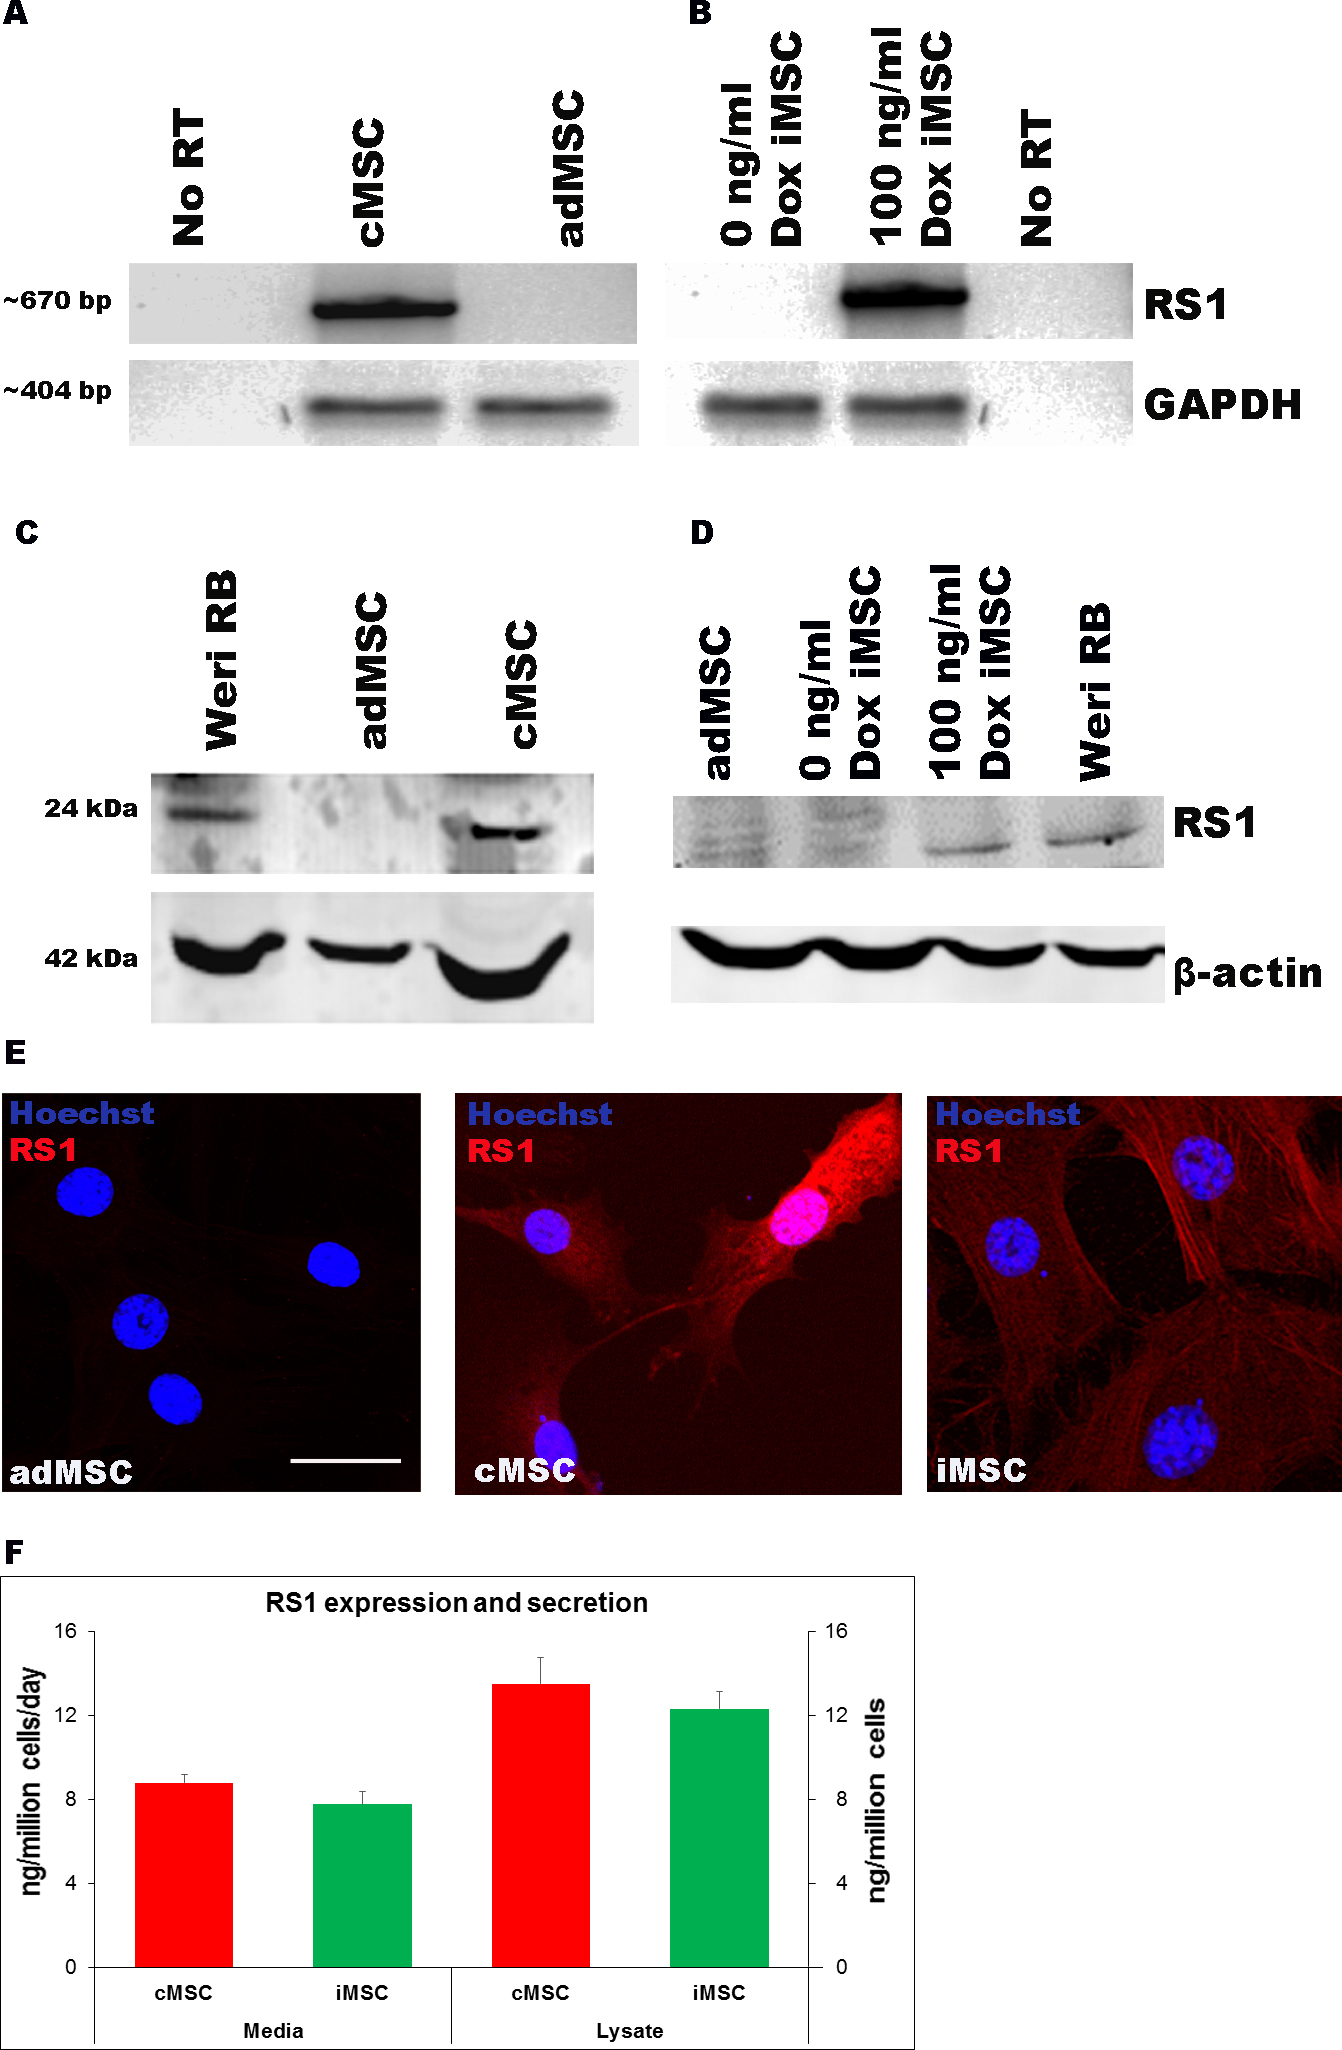
 Figure 1 of
Bashar, Mol Vis 2016; 22:718-733.
Figure 1 of
Bashar, Mol Vis 2016; 22:718-733.