Figure 7. Pou4f2Cre-mediated recombination within visual centers of the brain. The percentage of neurons in which recombination was targeted
by Cre was quantified within three visual centers of the brain (SCN, LGN and SC) in the vibratome sections of the Pou4f2Cre/+ Ai9 brains stained with 4,6-diamidino-2-phenylindole (DAPI). A–C: Images showing the location of the visual centers. D–F: High-magnification images used to quantify the number of cells positive for Cre-mediated recombination. G: Graph illustrating the percentage of cells targeted by Cre (n = 1 animal). Abbreviations: SCN = suprachiasmatic, LGN = lateral
geniculate nucleus, SC = superior colliculus. Scale bar in C = 2 mm. Scale bars in A’–C’= 1 mm. Scale bar in F’’ = 40 μm.
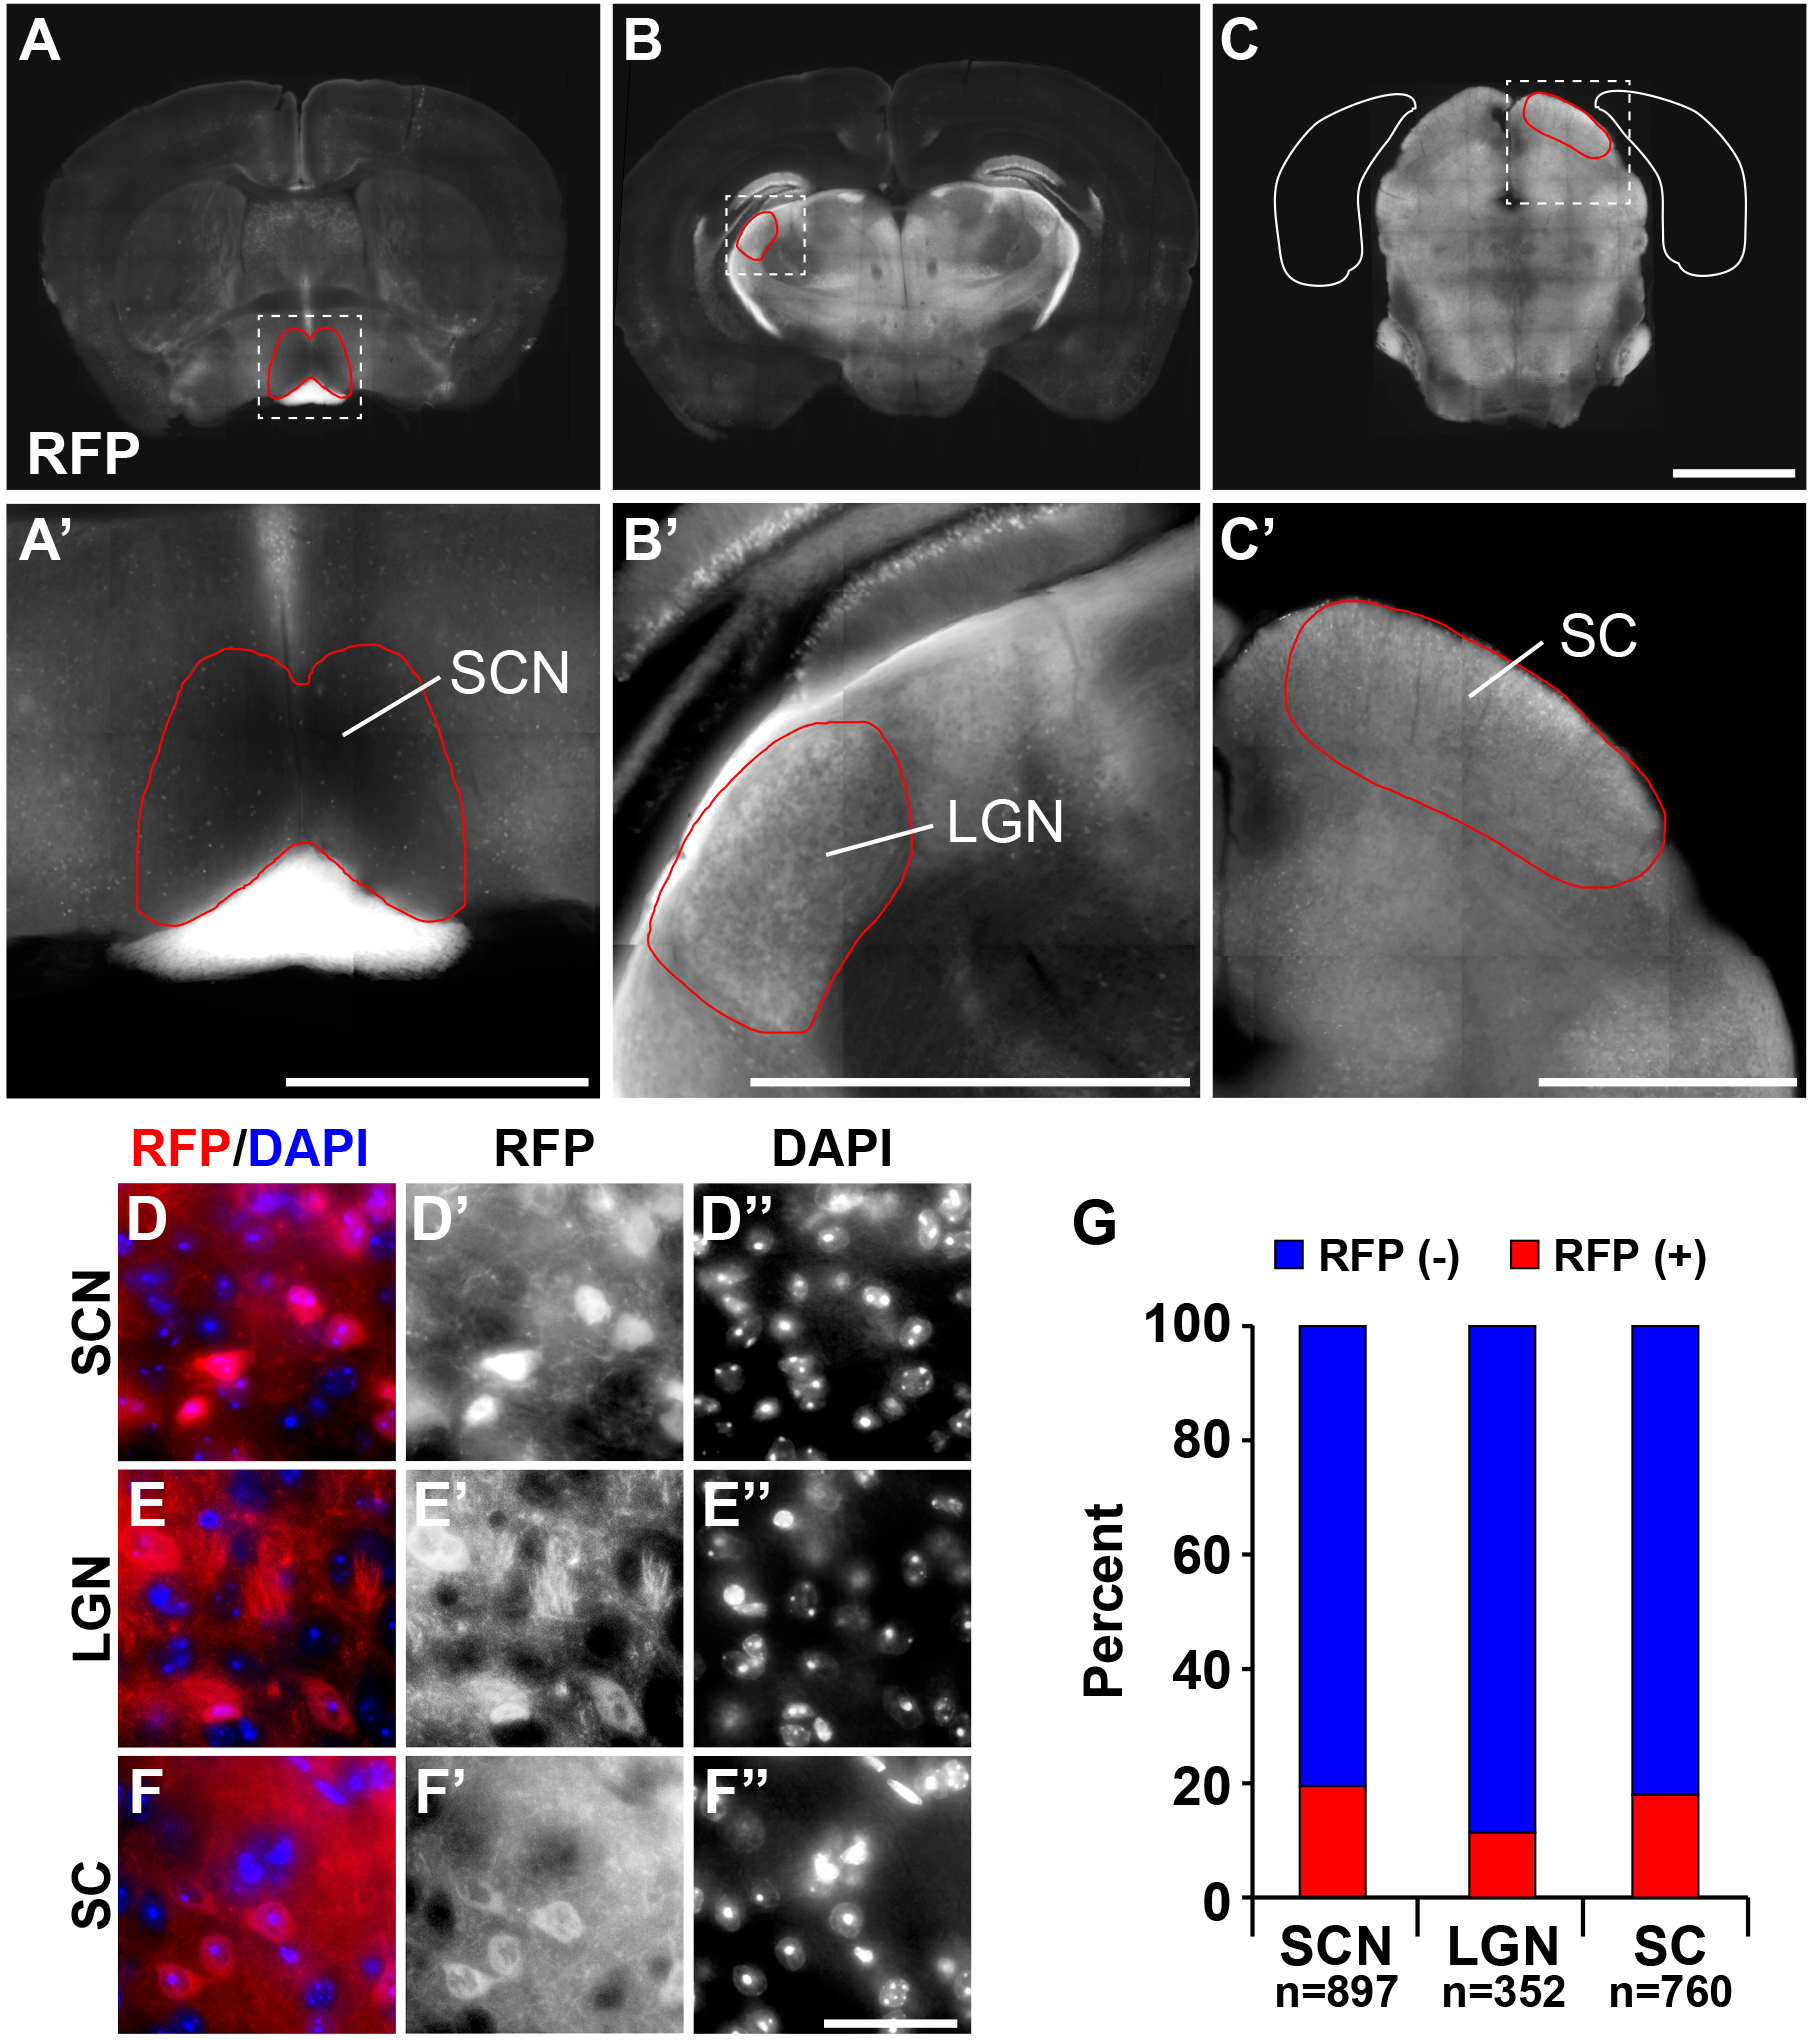
 Figure 7 of
Simmons, Mol Vis 2016; 22:705-717.
Figure 7 of
Simmons, Mol Vis 2016; 22:705-717.