Figure 5. The evaluation of the identified molecular signature for PDR/NPDR prediction. A: Receiver operating characteristic (ROC) curve from 1,000 cross-validations. B: PCA plot of 20 non-proliferative diabetic retinopathy (NPDR) samples and 20 proliferative diabetic retinopathy (PDR) samples.
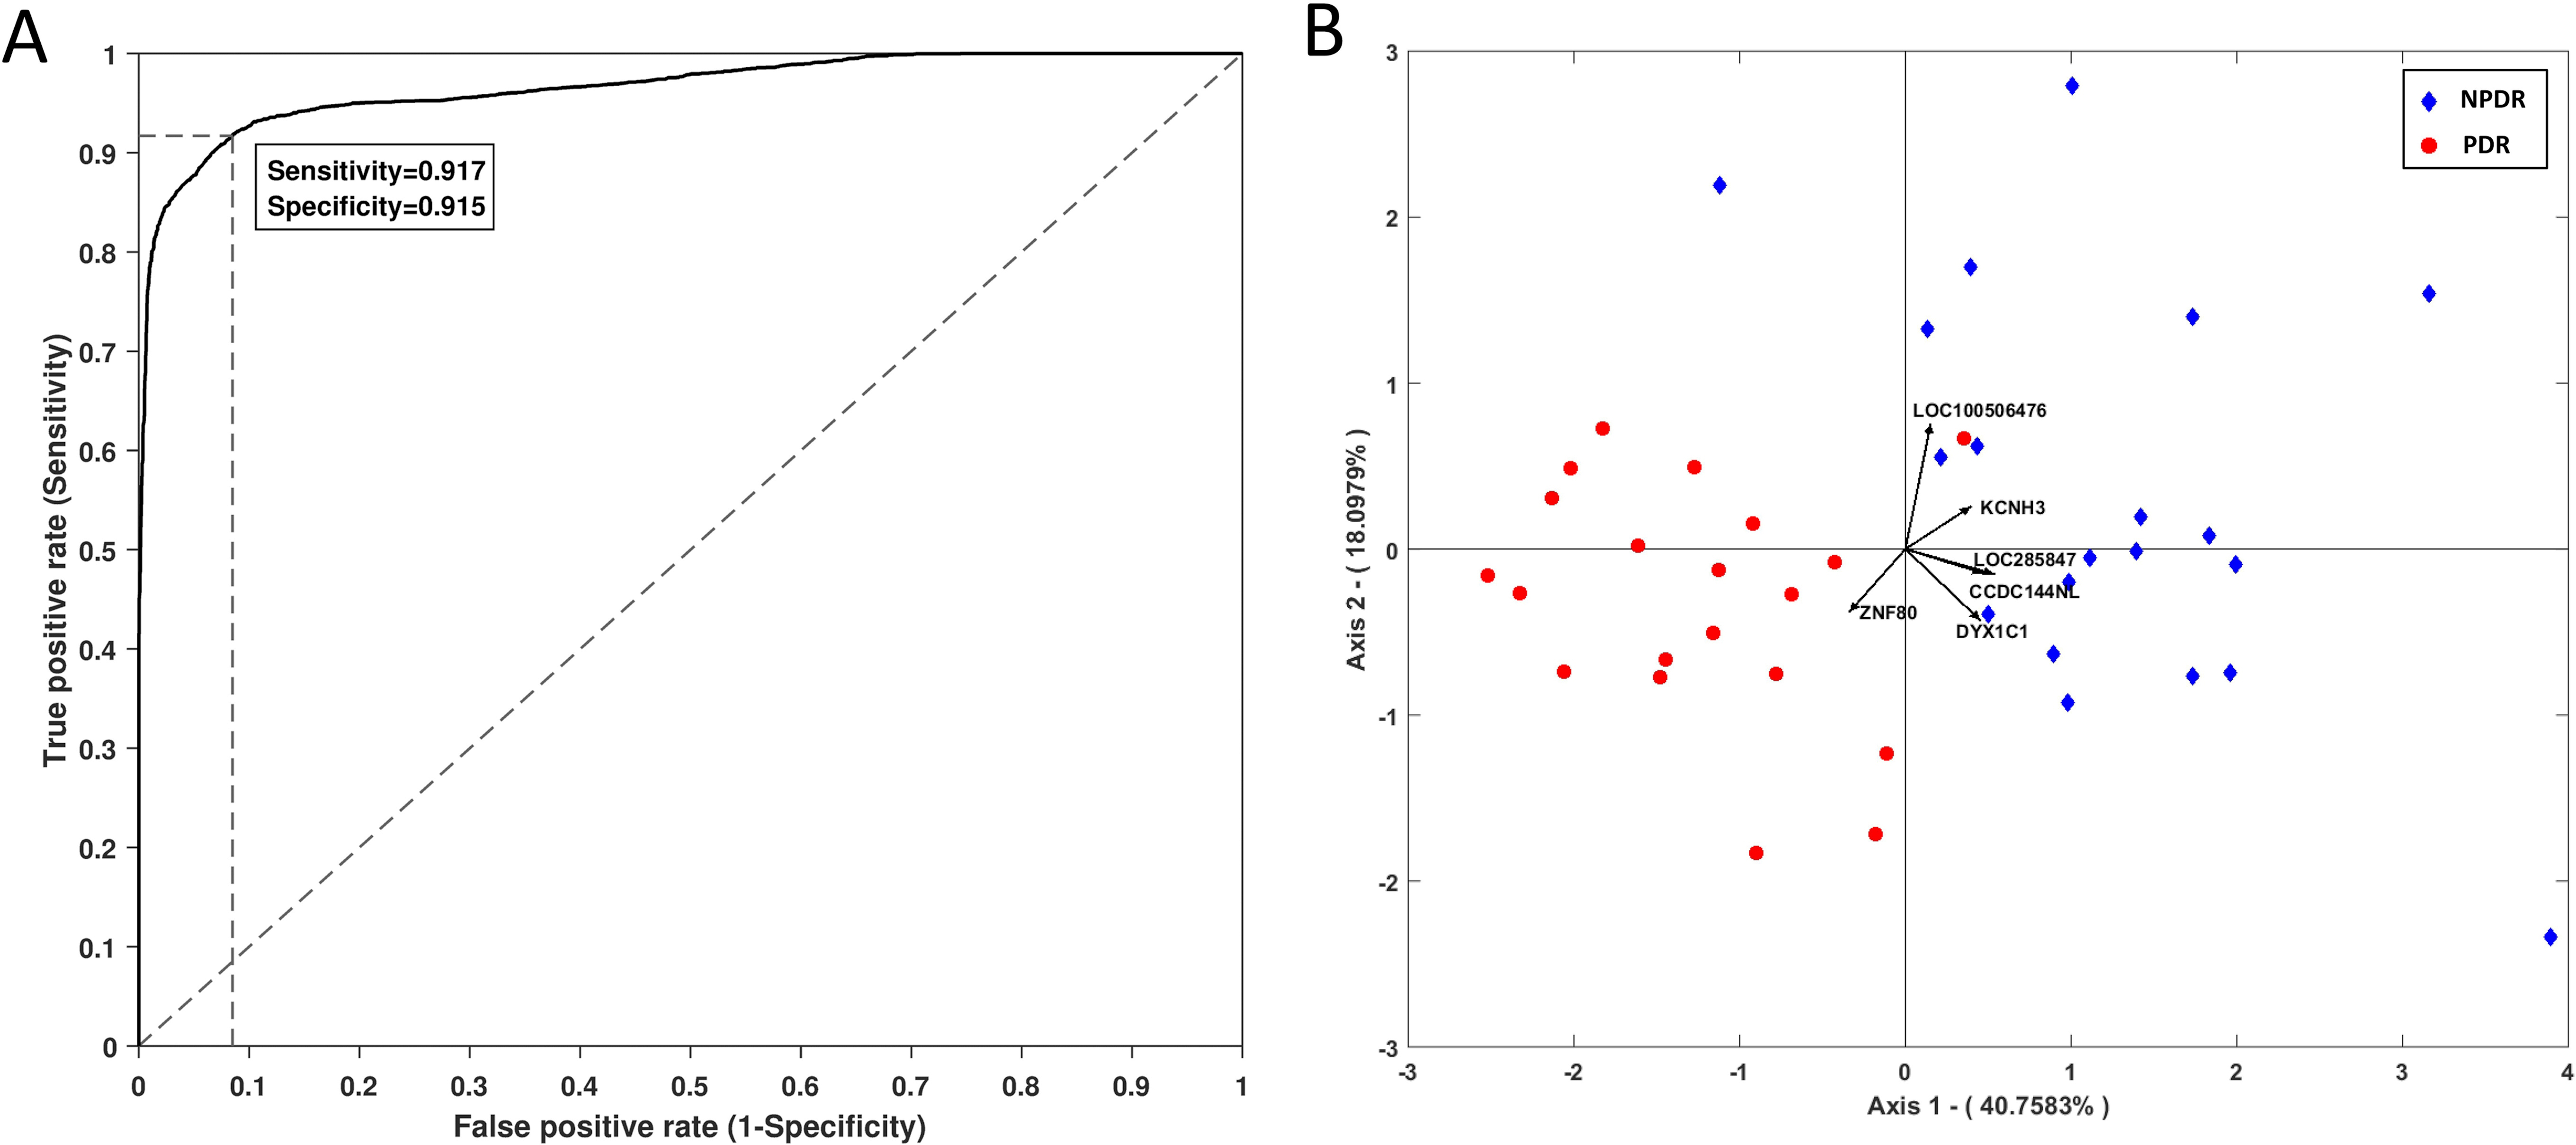
 Figure 5 of
Pan, Mol Vis 2016; 22:636-645.
Figure 5 of
Pan, Mol Vis 2016; 22:636-645.