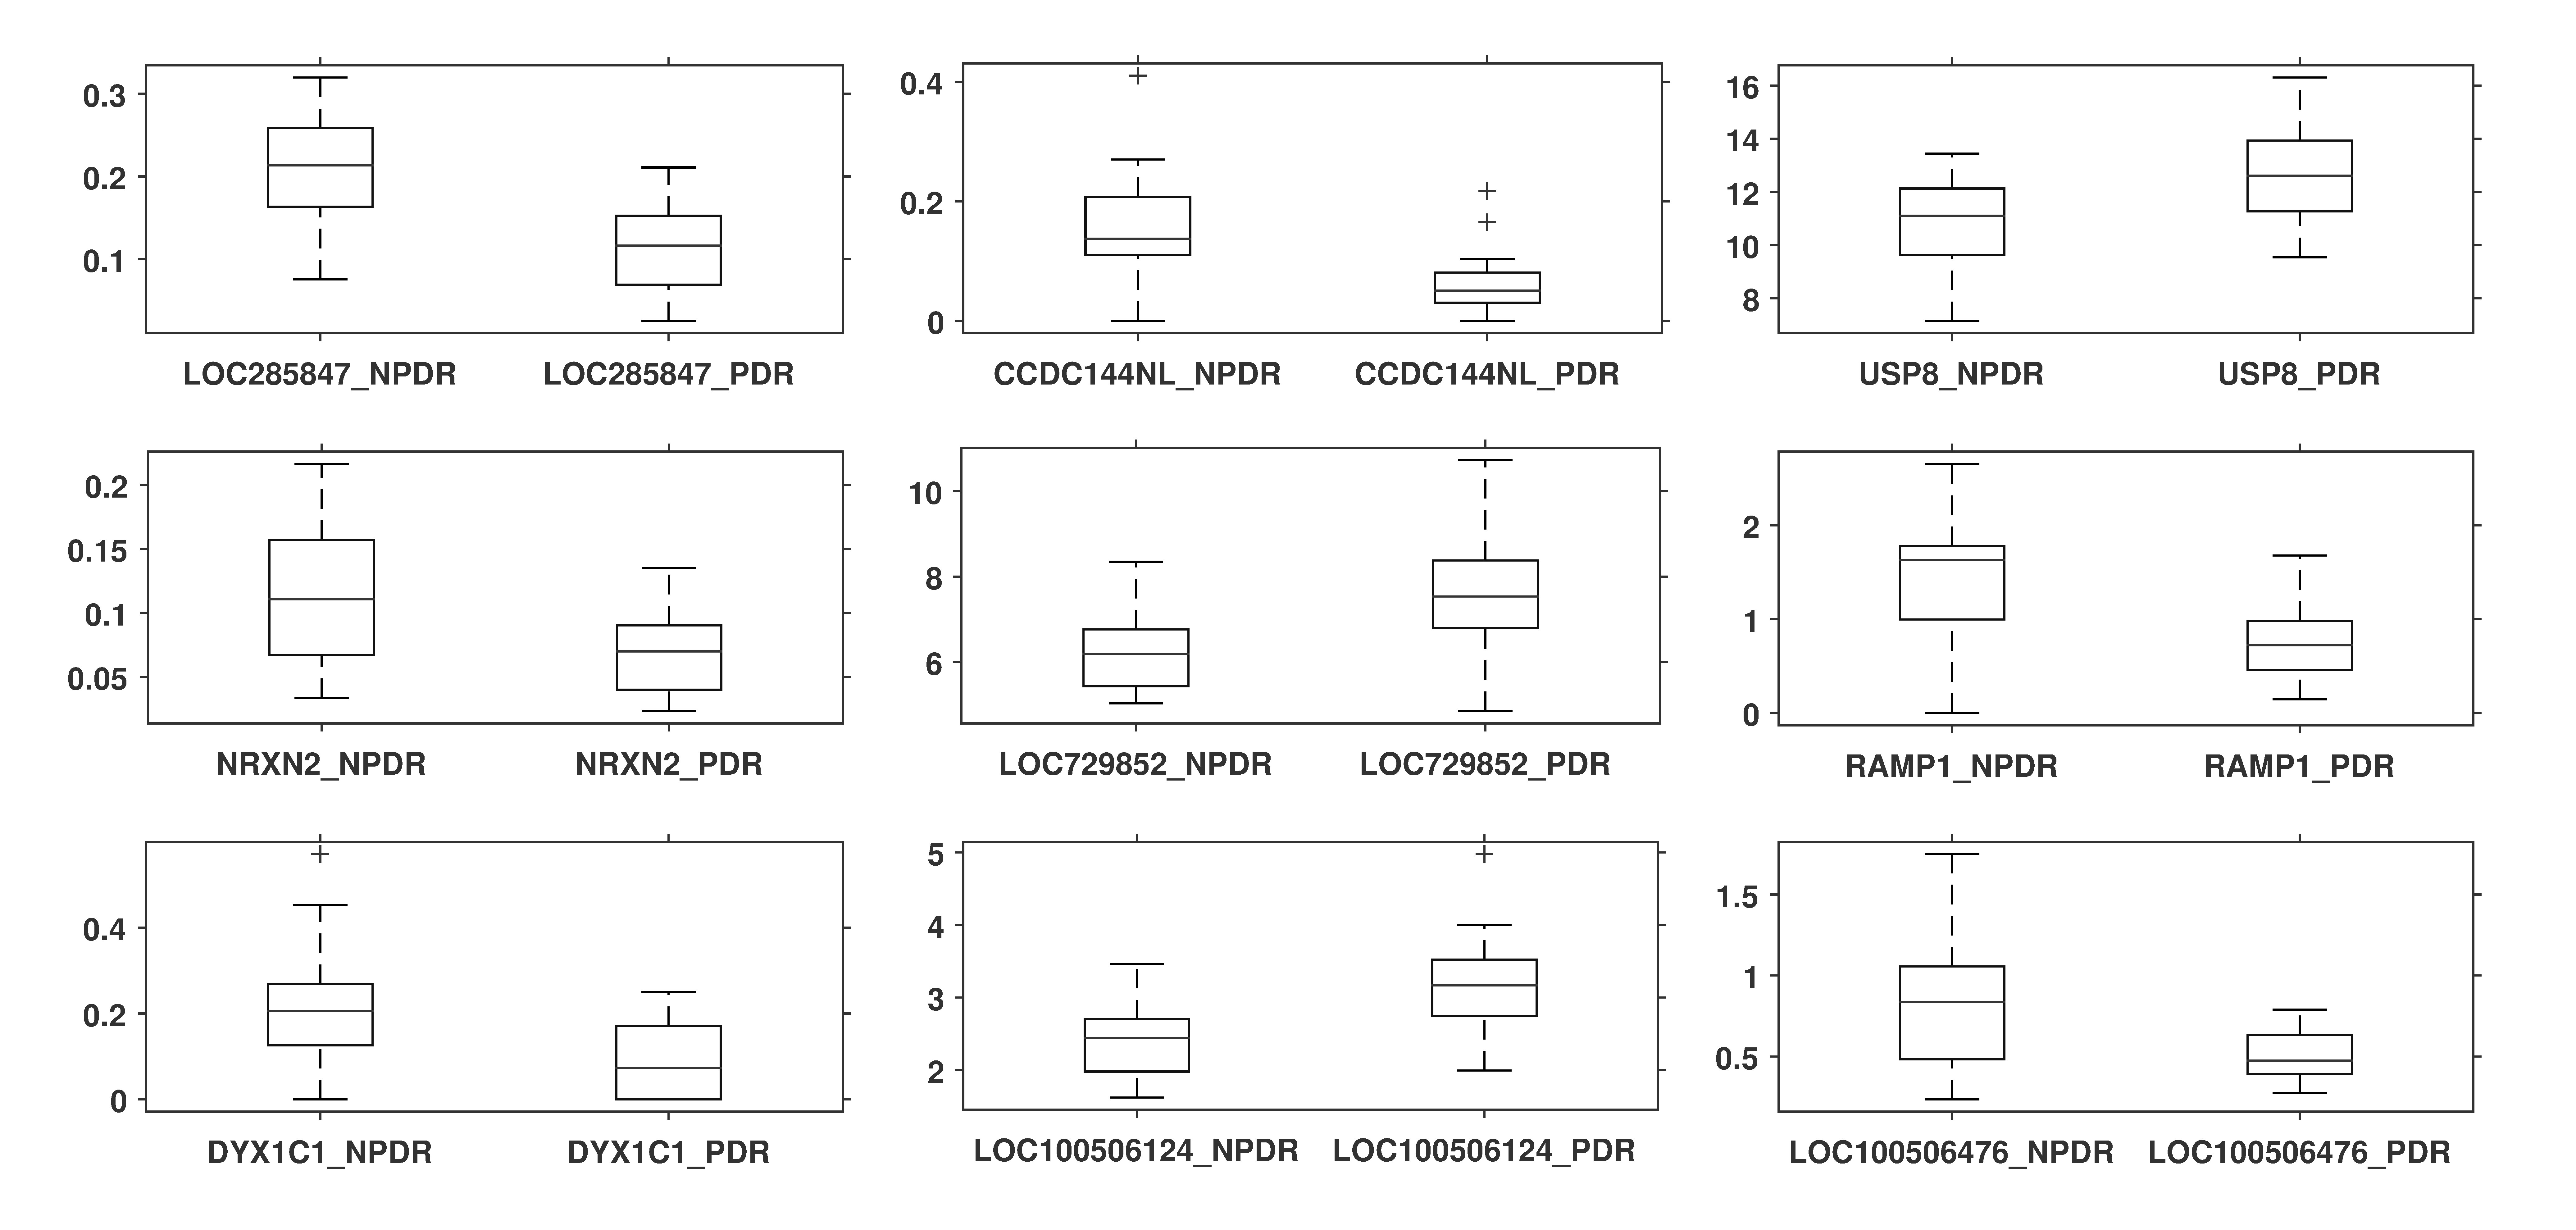
Figure 2. Boxplots of the expression data of the top nine differentially expressed genes in the NPDR and PDR samples. The suffixes “_NPDR”
and “_PDR” indicate the reads per kilo base per million (RPKM) distribution of the non-proliferative diabetic retinopathy
(NPDR) samples and the proliferative diabetic retinopathy (PDR) samples, respectively.

 Figure 2 of
Pan, Mol Vis 2016; 22:636-645.
  Figure 2 of
Pan, Mol Vis 2016; 22:636-645.