Figure 2 of
Hull, Mol Vis 2016; 22:626-635.
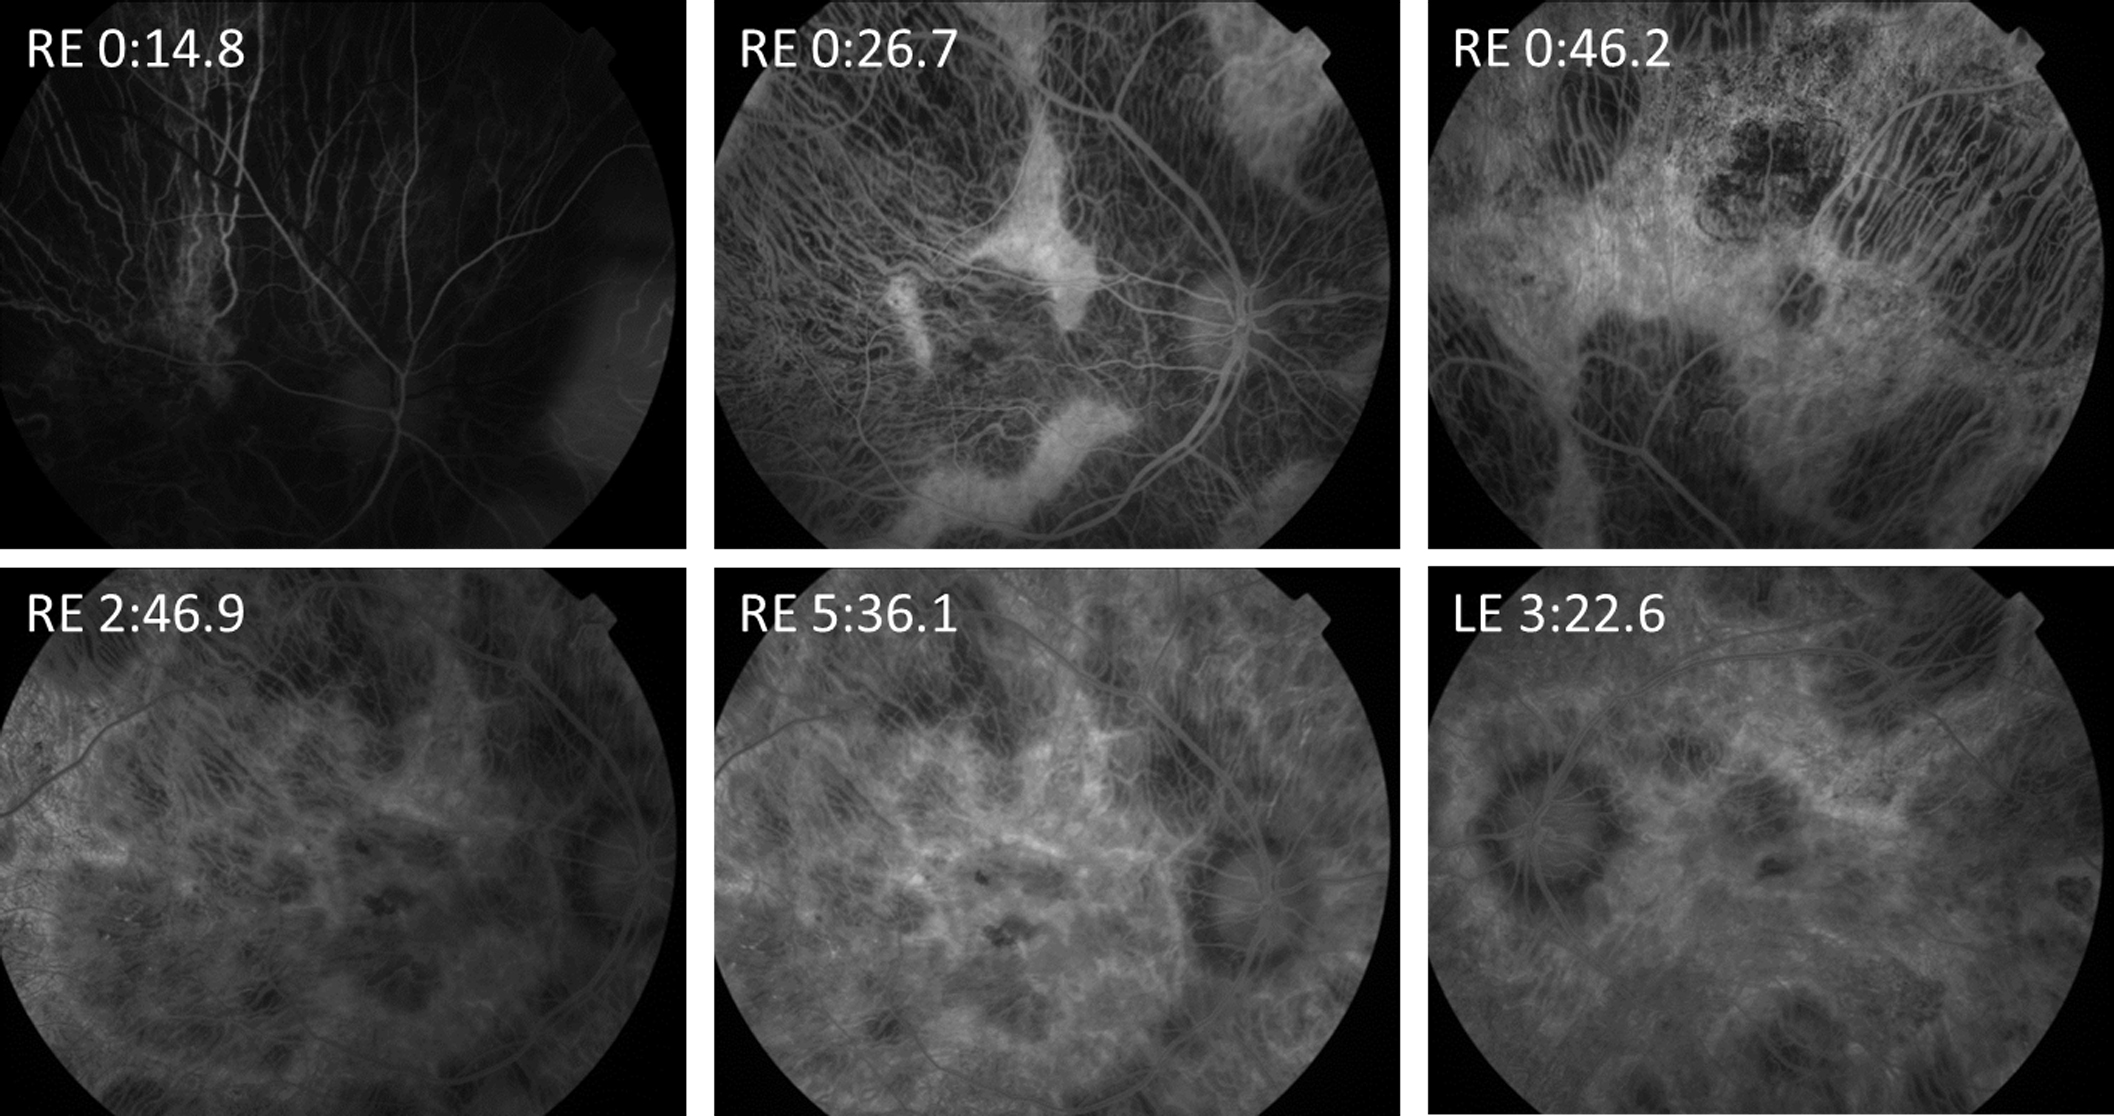
Figure 2.
Fundus fluorescein angiogram of patient 1.2 at increasing time points. Relative preservation of the retinal vasculature is apparent with the easily visible choroidal vasculature. RE, right eye. LE, left eye. Time in minutes.
 Figure 2 of
Hull, Mol Vis 2016; 22:626-635.
Figure 2 of
Hull, Mol Vis 2016; 22:626-635.