Figure 7. Transmission electron micrographs showing the retinal capillary endothelial BM. A: Thickening of the basement membrane (BM) was observed in the DC group but not in the 6-G group. B: Quantitative expression of capillary BM thickness in three groups after 24 weeks of treatment (n=4 for all groups). Values
are mean ± standard deviation (SD).*p<0.0001 versus NC, #p<0.0001 versus DC. NC = normal control; DC = diabetic control; 6-G = Zingiber officinale–treated diabetic group.
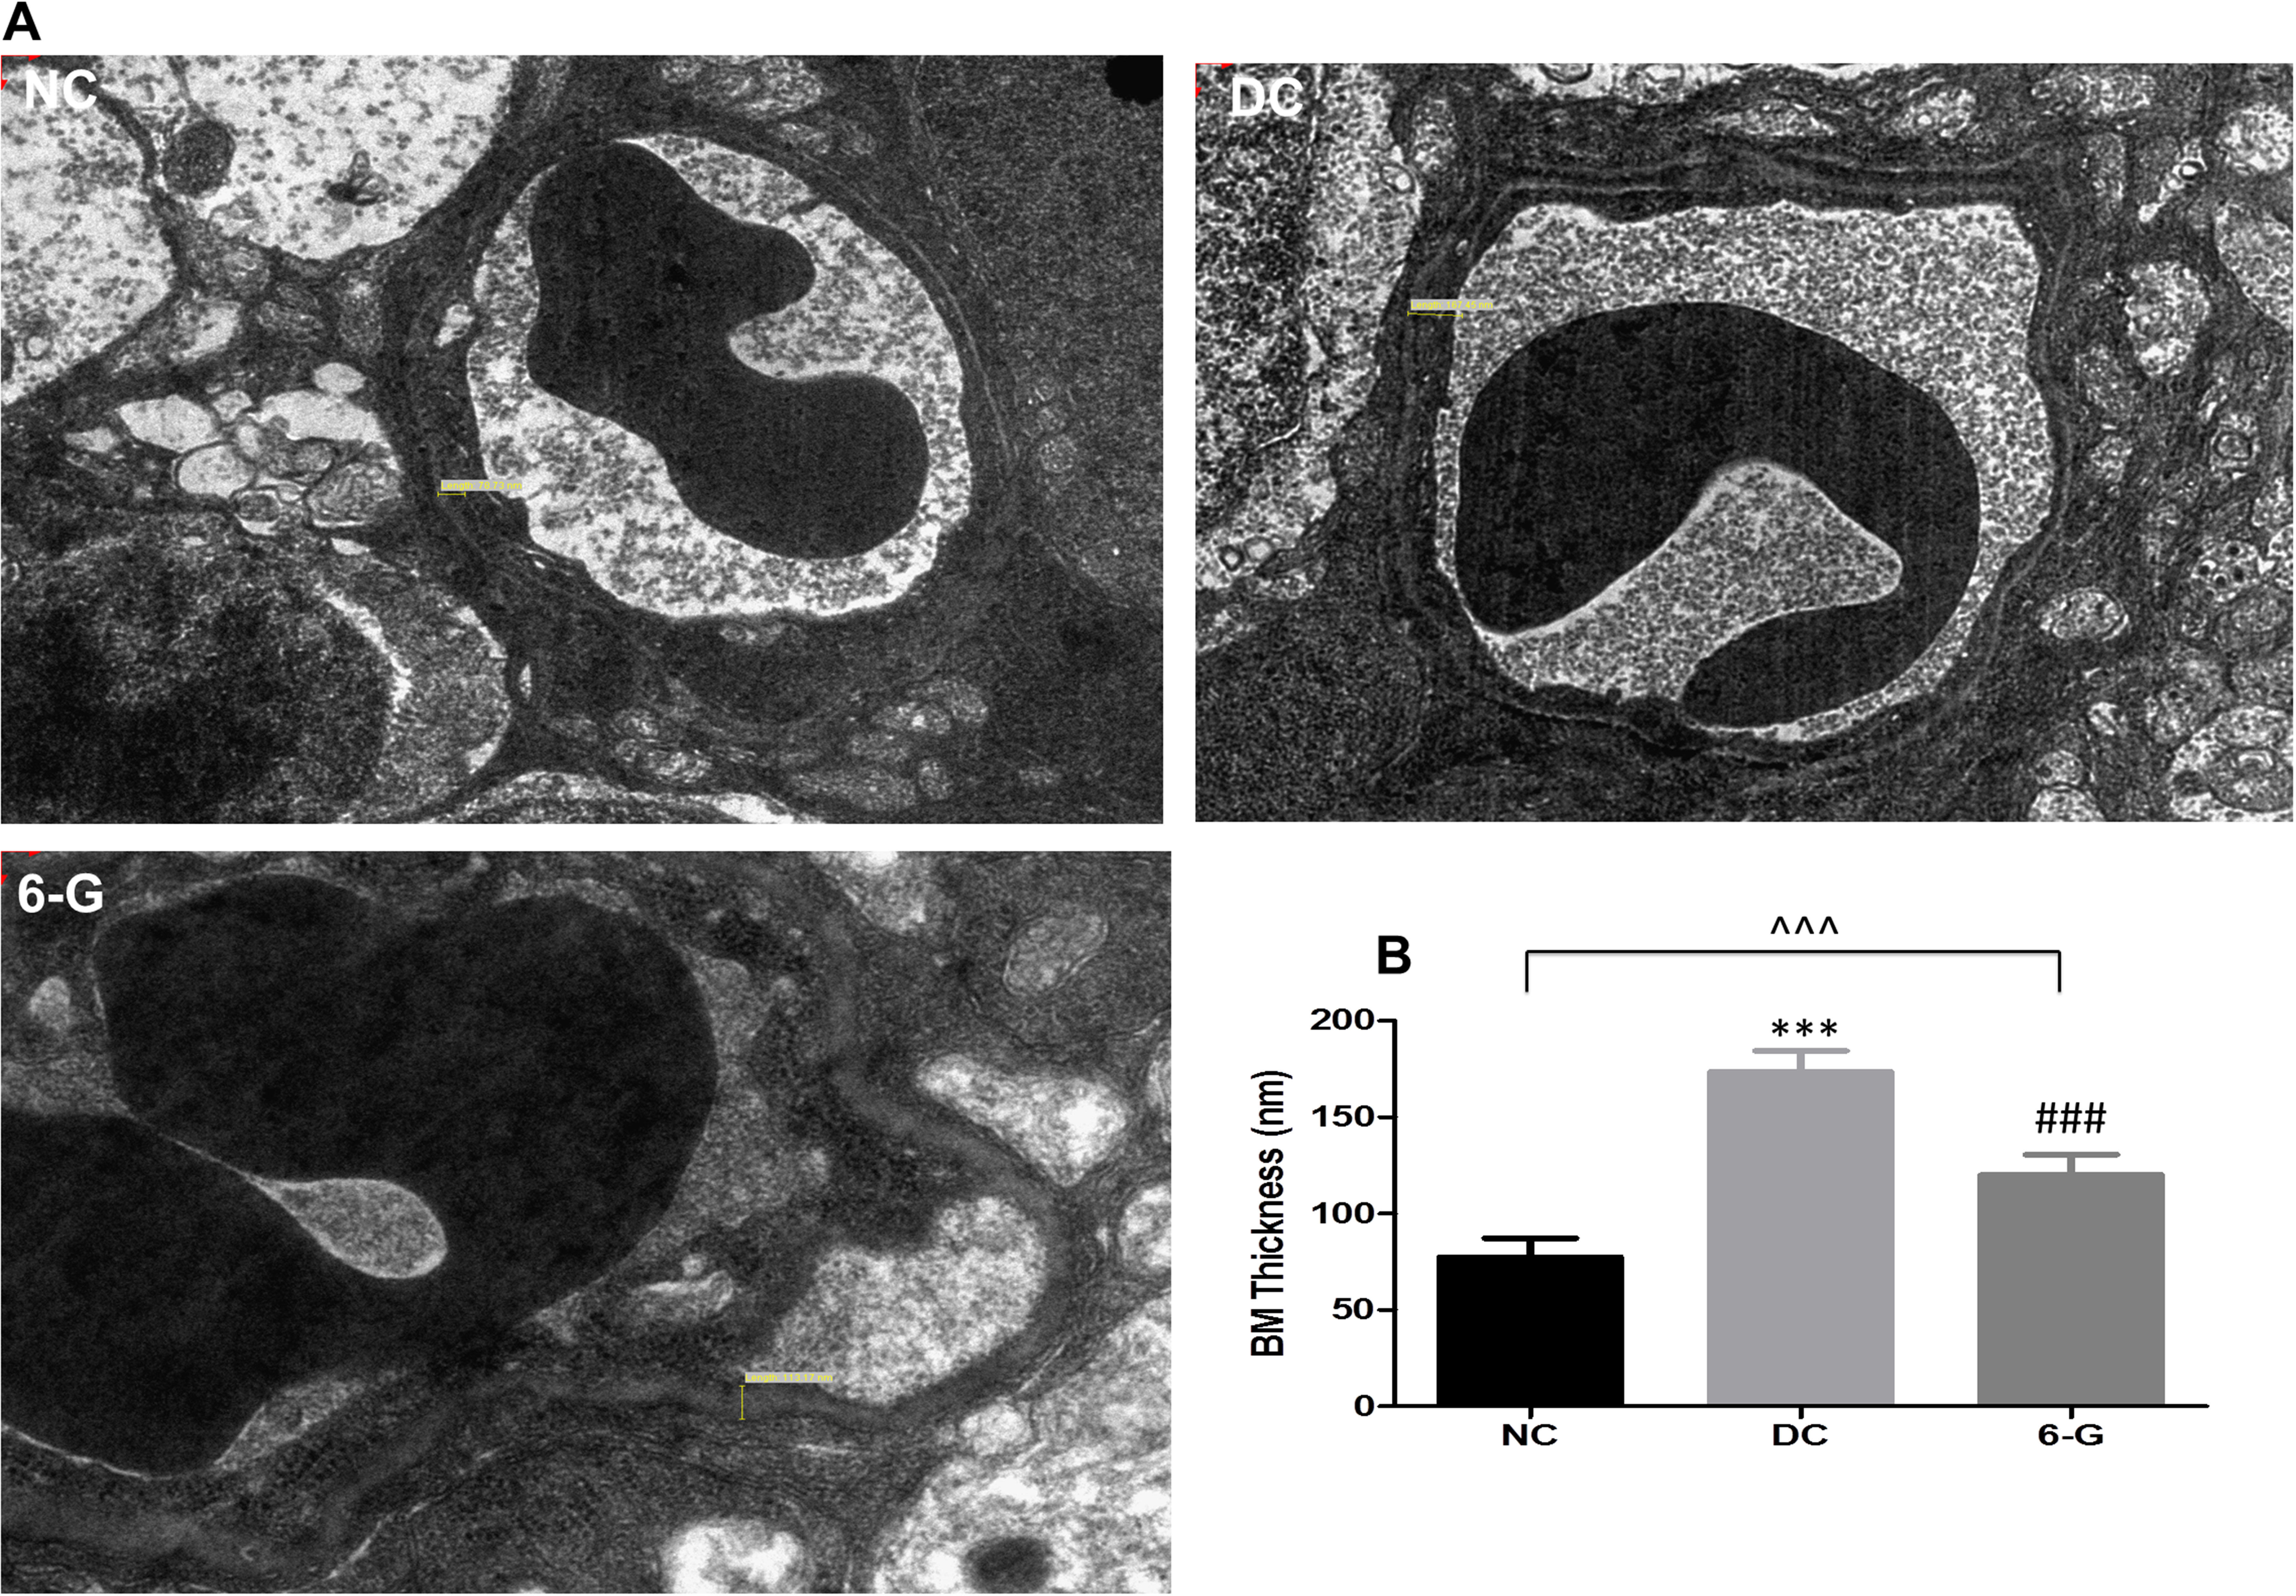
 Figure 7 of
Dongare, Mol Vis 2016; 22:599-609.
Figure 7 of
Dongare, Mol Vis 2016; 22:599-609.