Figure 3. Fundus photographs after 24 weeks of treatment with standardized extract of Zingiber officinale in the rats with STZ-induced diabetes. Fundus photographs in the NC group show normal vascular architecture. In the DC group,
the fundus photographs show dilated vessels. In the 6-G-treated group, the retinal vessel showed normalization of the vessel
diameter (n=15 for all groups). Values are mean ± standard deviation (SD); *p<0.0001 versus the corresponding NC group; #p<0.0001 versus the corresponding DC group. NC = normal control; DC = diabetic control; 6-G = Zingiber officinale–treated.
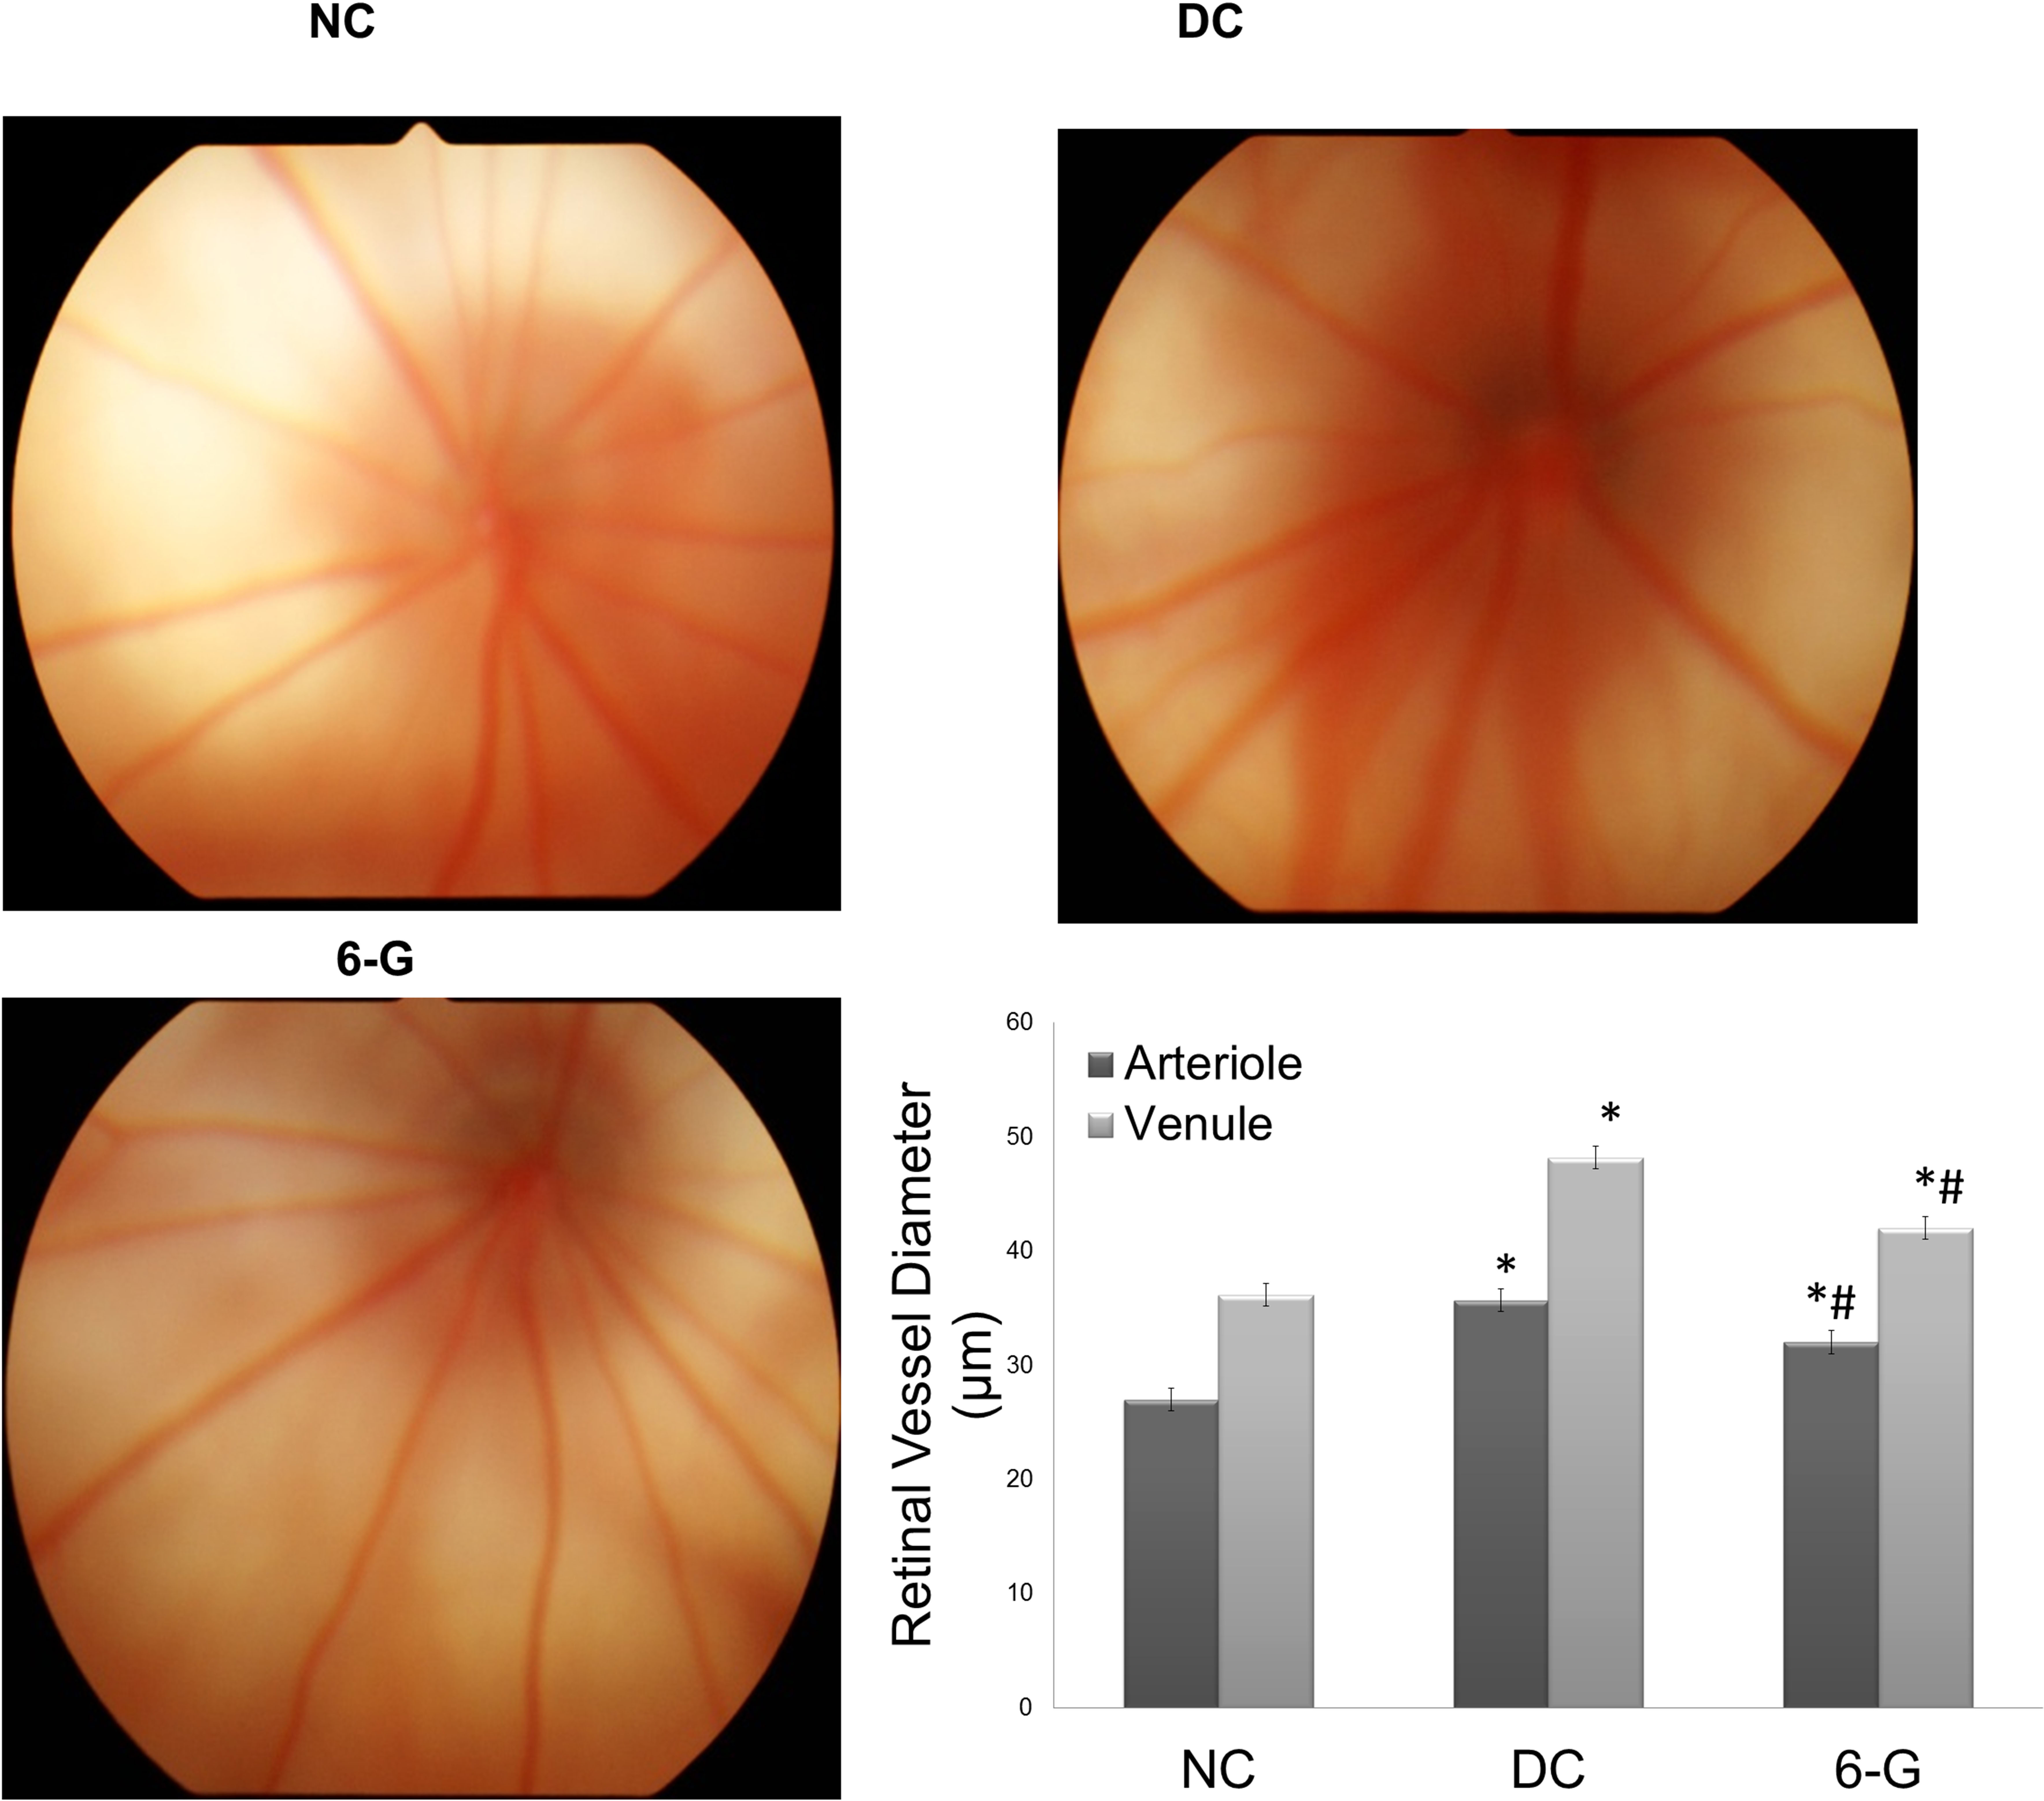
 Figure 3 of
Dongare, Mol Vis 2016; 22:599-609.
Figure 3 of
Dongare, Mol Vis 2016; 22:599-609.