Figure 6. Phagocytic activity of resident microglia and infiltrating myeloid cells in the ischemic retina. A: The mean side scatter intensity was quantified at 72 h after sham or stroke. B: The mean fluorescence intensity of CD11b+ microglia was quantified at 72 h after sham or stroke. The phagocytic potential of retinal myeloid cells after middle cerebral
artery occlusion (MCAO) was assessed using ex vivo fluorescent bead assay, and the percentage of phagocytic myeloid cells
was measured using flow cytometry. C: A representative histogram shows the relative phagocytic activity of resident microglia after sham (black) and stroke (blue)
and infiltrating CD45hiCD11b+ myeloid cells (red). Positive gating was determined using fluorescence minus one (FMO) control (shaded gray). D: The percentages of bead-positive CD45intCD11b+ microglia versus CD45hiCD11b+ myeloid cells were quantified at three time points. Error bars show mean ± standard error of mean (SEM). Abbreviations: MFI
= mean fluorescence intensity, a.u.i. = arbitrary units of intensity, SH = sham, ST = stroke. *p<0.05; **p<0.01; ***p<0.001.
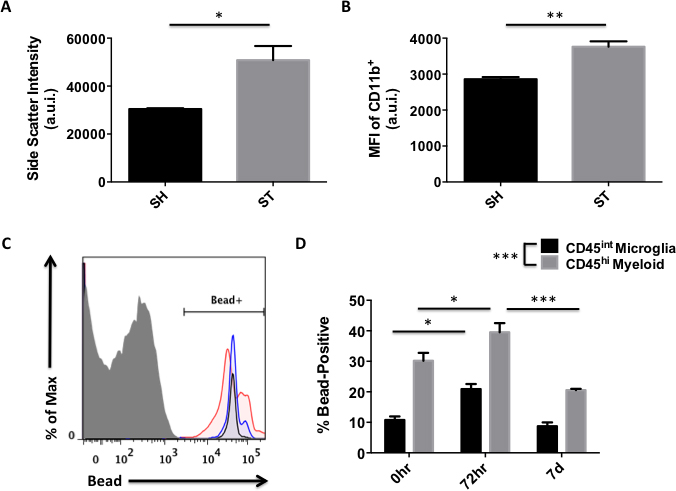
 Figure 6 of
Ritzel, Mol Vis 2016; 22:575-588.
Figure 6 of
Ritzel, Mol Vis 2016; 22:575-588.