Figure 5. Changes in the number of resident retinal microglia and infiltrating bone marrow–derived myeloid cells over 7 days after MCAO.
Mice were subject to 90 min of occlusion followed by 72 h or 7 days of reperfusion and analyzed with flow cytometry (n = 5/group).
A: A representative dot plot shows resident microglia (CD45intCD11b+) and infiltrating leukocyte (CD45hi) populations in the ipsilateral sham and stroke eyes at 72 h. B: A representative dot plot shows the identification of monocyte (Ly6C+Ly6G-) and neutrophil (Ly6C+Ly6G+) subsets of infiltrating myeloid (CD45hiCD11b+) cells. C: The absolute number of resident microglia was quantified in the sham and stroke groups. D: The absolute number of infiltrating leukocytes was quantified in the sham and stroke groups. E: Pie charts depict the cellular composition of the infiltrating myeloid (CD45hiCD11b+) cell fraction in sham (0 h) and at 72 h and 7 days. Error bars show mean ± standard error of mean (SEM). *p<0.05; **p<0.01;
***p<0.001.
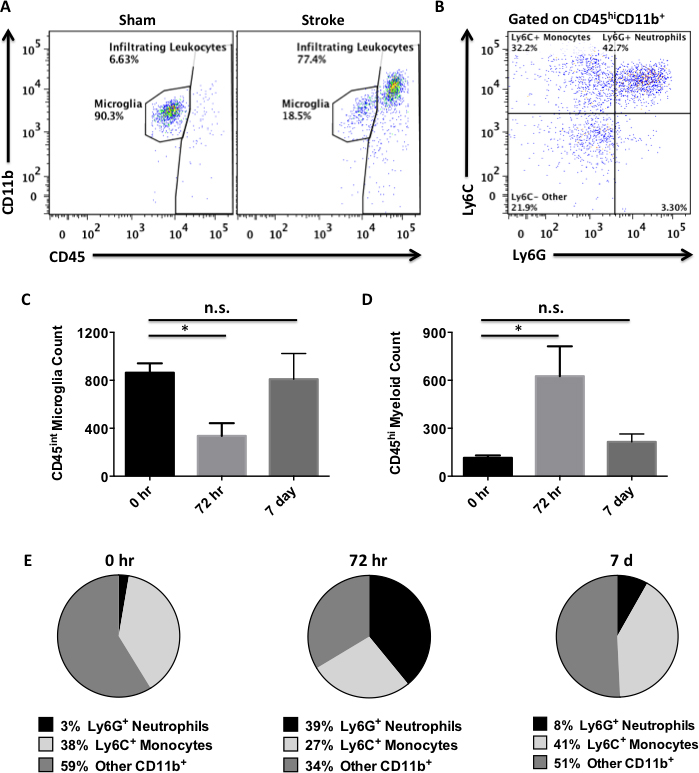
 Figure 5 of
Ritzel, Mol Vis 2016; 22:575-588.
Figure 5 of
Ritzel, Mol Vis 2016; 22:575-588.