Figure 3. Differential cytokine expression and vascular permeability at 72 h. Quantitative real-time PCR analysis shows no difference
in interleukin-1 beta (IL-1β) (A) and tumor necrosis factor (TNF) (B) mRNA expression in the ipsilateral eye after stroke compared to sham at 72 h. Expression of the inflammatory signaling genes
monocyte chemoattractant protein-1 (CCL2) (C) and myeloperoxidase (MPO) (D) continued to be increased at 72 h following ischemia. For all quantitative real-time PCR experiments, n = 5/group. Vascular
permeability in the eye was measured following injection of low molecular weight (sodium fluorescein (NaF), E) and high molecular weight (Evans Blue, F) dye tracers at 72 h in the stroke and sham groups (n = 10/group). Error bars show mean ± standard error of mean (SEM). Abbreviation:
GAPDH = glyceraldehyde 3-phosphate dehydrogenase, SH = sham, ST = stroke, NaF. *p<0.05; **p<0.01; ***p<0.001.
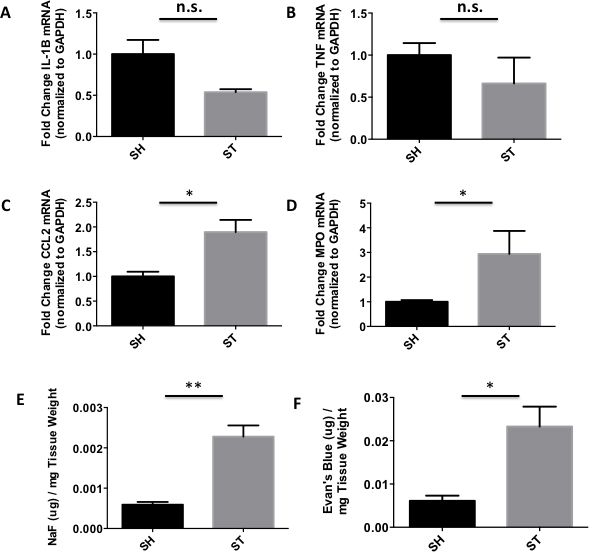
 Figure 3 of
Ritzel, Mol Vis 2016; 22:575-588.
Figure 3 of
Ritzel, Mol Vis 2016; 22:575-588.