Figure 3. The cytokine profile in the VH from patients with endophthalmitis (n=15) and controls (n=16). A: The expression of 20 cytokines was detected using antibody cytokine array. The interleukin (IL)-1β, IL-6, and macrophage
inflammatory protein (MIP)-3α levels were significantly upregulated in the patients with endophthalmitis compared to the healthy
control samples. Data are represented as mean±SD *p<0.05. B: Heatmap of cluster analysis. Cluster analysis was performed with the 20 chosen cytokines. The horizontal bar on the left
of the heatmap indicates the cytokine expression. C: Heatmap of cluster analysis of three of the 20 cytokines. The endophthalmitis group and the control group completely segregated
into two principle clusters. D: Representative fluorescent signal images for the antibody array in the vitreous humor (VH). The additional cytokines are
marked in red.
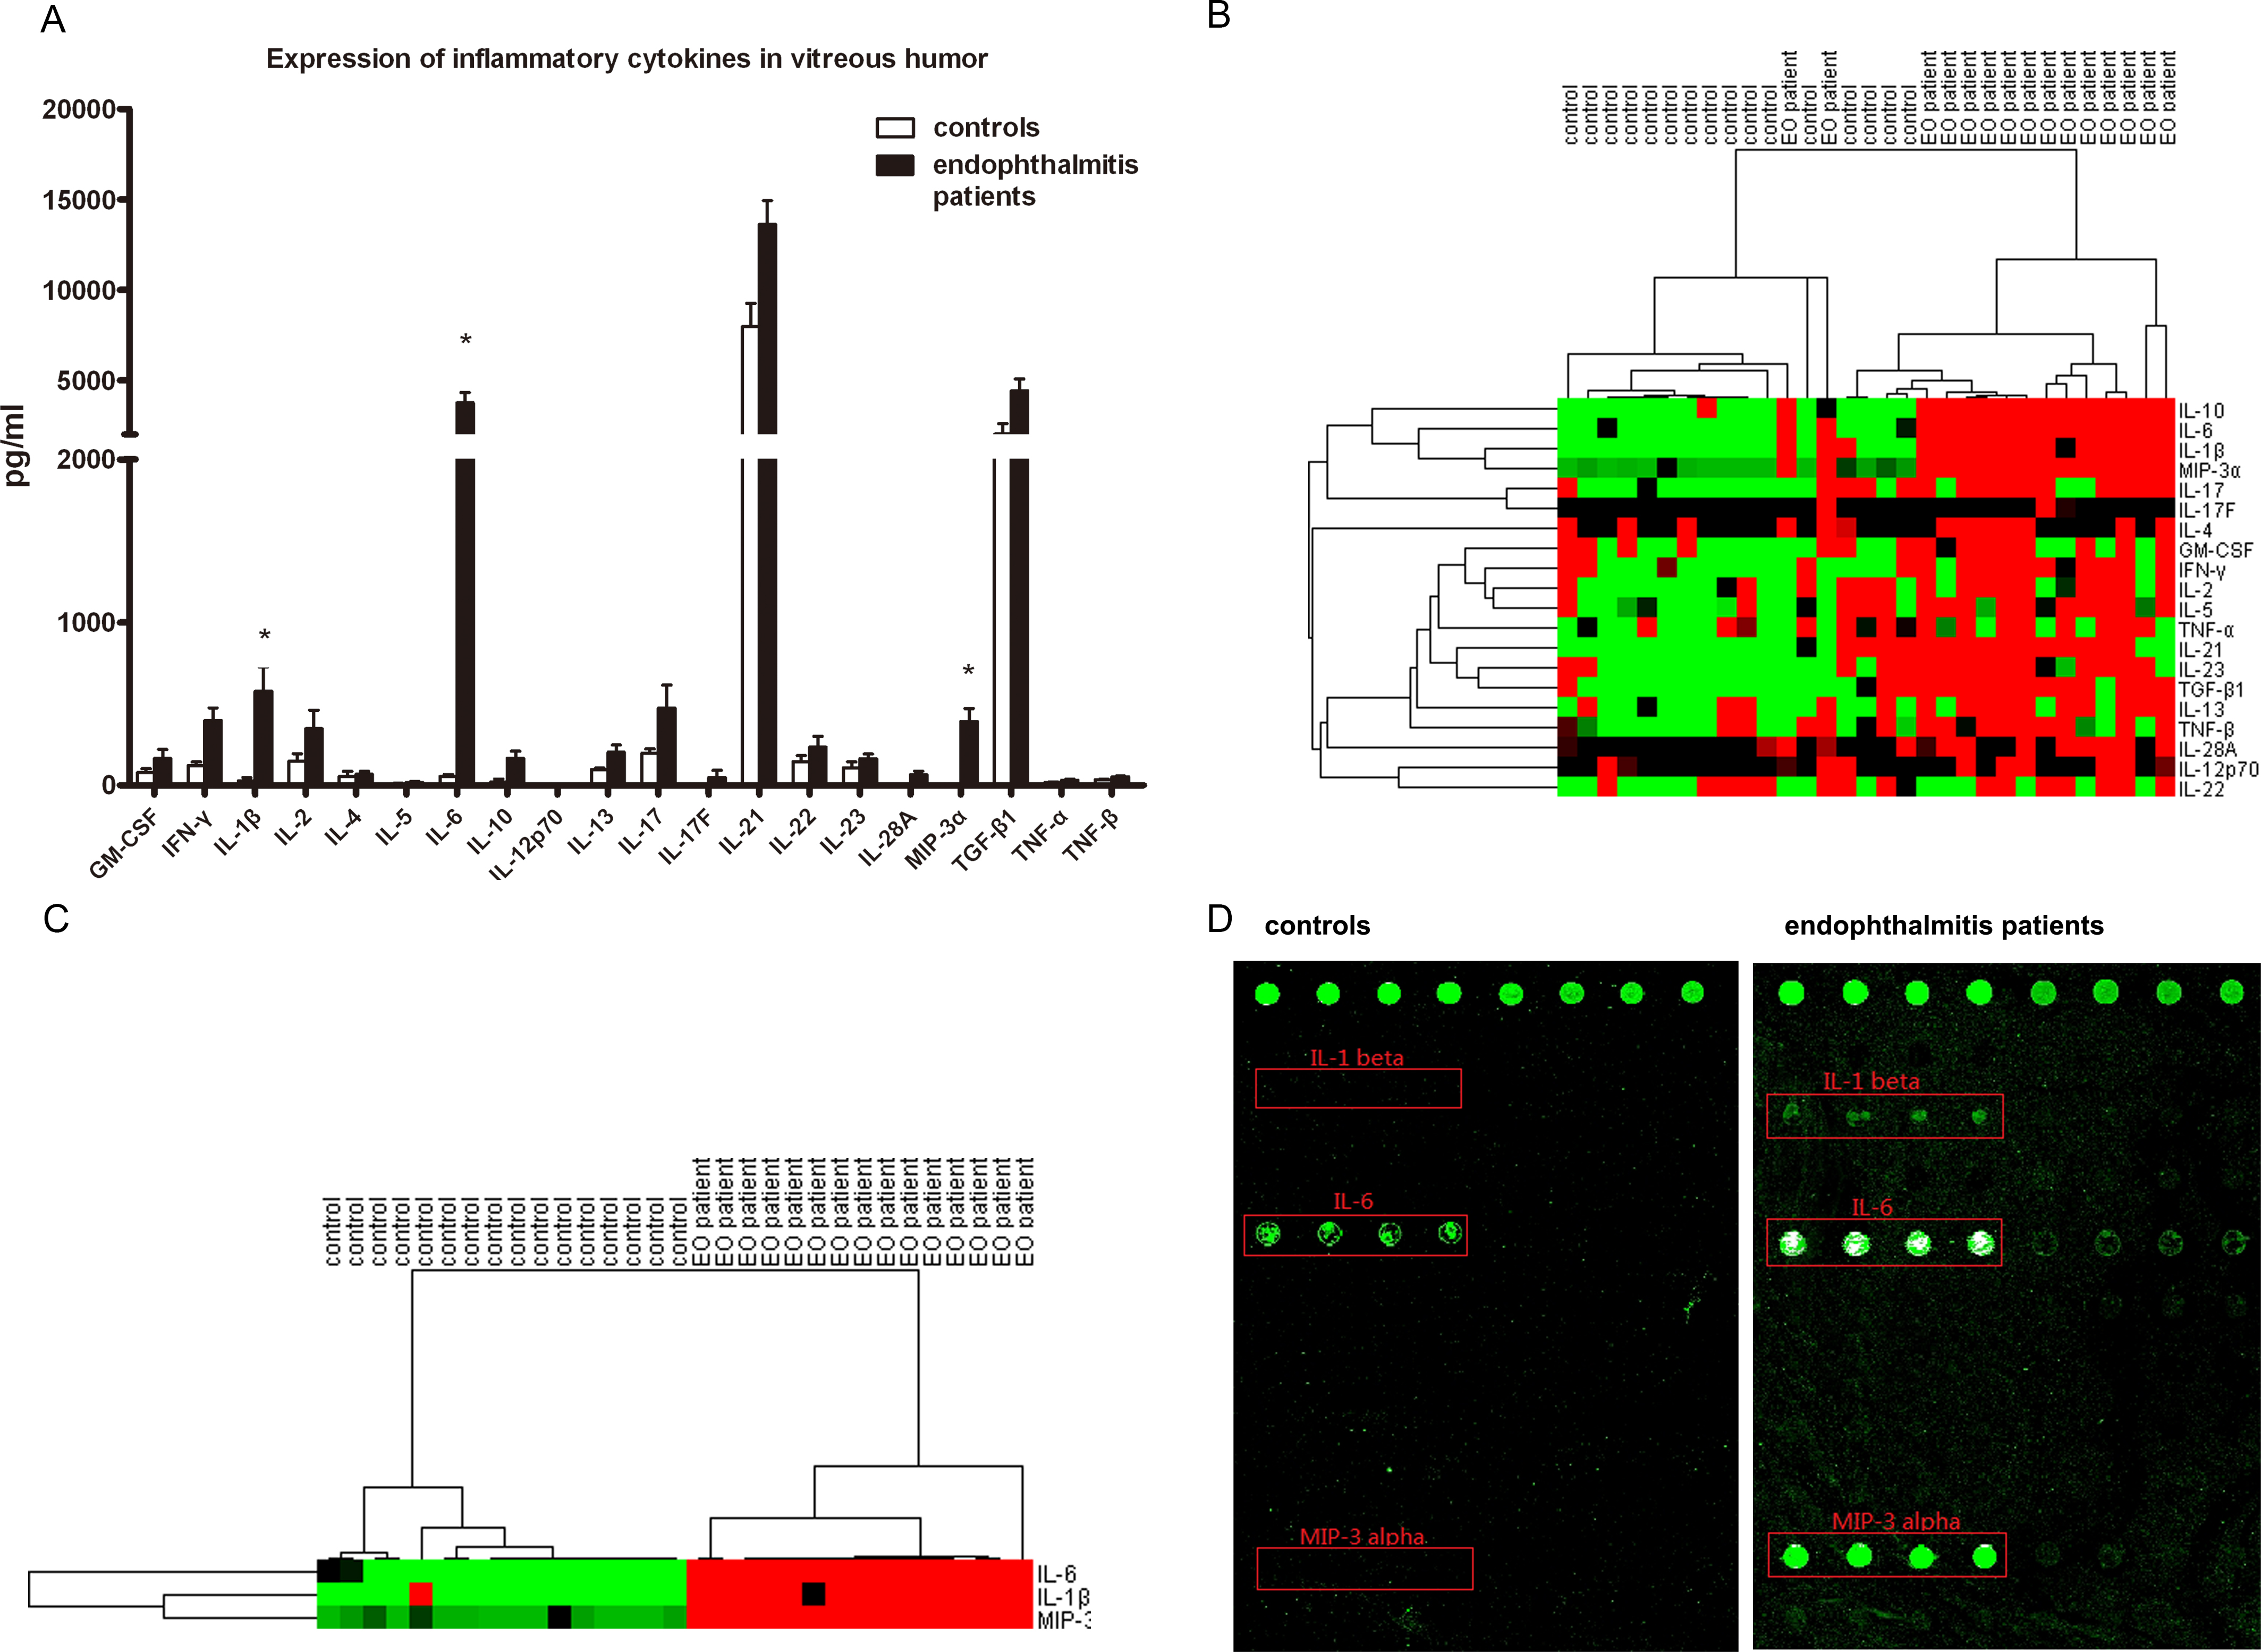
 Figure 3 of
Hao, Mol Vis 2016; 22:563-574.
Figure 3 of
Hao, Mol Vis 2016; 22:563-574.