Figure 2. The cytokine profile in the aqueous humor from patients with endophthalmitis (n=15) and controls (n=16). Abbreviations: IFN-γ
represents interferon gammar; IL represents interleukin; MIP represents Macrophage inflammatory protein; GM-CSF represents
granulocyte-macrophage colony-stimulating factor; TGF represents transforming growth factor; TNF represents tumor necrosis
factor. A: The levels of GM-CSF, IL-1β, IL-2, IL-4, IL-5, IL-6, IL-10, IL-12p70, IL-13, IL-17A, IL-17F, IL-21, IL-22, IL-23, IL-28,
IFN-γ, MIP-3α, TNF-α, TGF-β1, and TNF-β were detected using an antibody cytokine array. Data are represented as mean±SD *p<0.05.
B: Heatmap of cluster analysis. Cluster analysis was performed with data from 20 cytokines and represented in a dendrogram.
The horizontal bar on the left of the heatmap indicates cytokine expression. Higher expression is displayed in red, and lower
expression is displayed in blue. Upregulation or downregulation of cytokines is indicated on a scale from red to green, respectively.
The vertical lines indicate patients and controls. C: A heatmap of the cluster analysis was performed with eight of the chosen 20 cytokines. The differentially expressed cytokines
were clearly associated with endophthalmitis with bacterial infection. D: Representative fluorescent mean intensities images for antibody array of AH. Additional cytokines in patients with endophthalmitis
is marked in red.
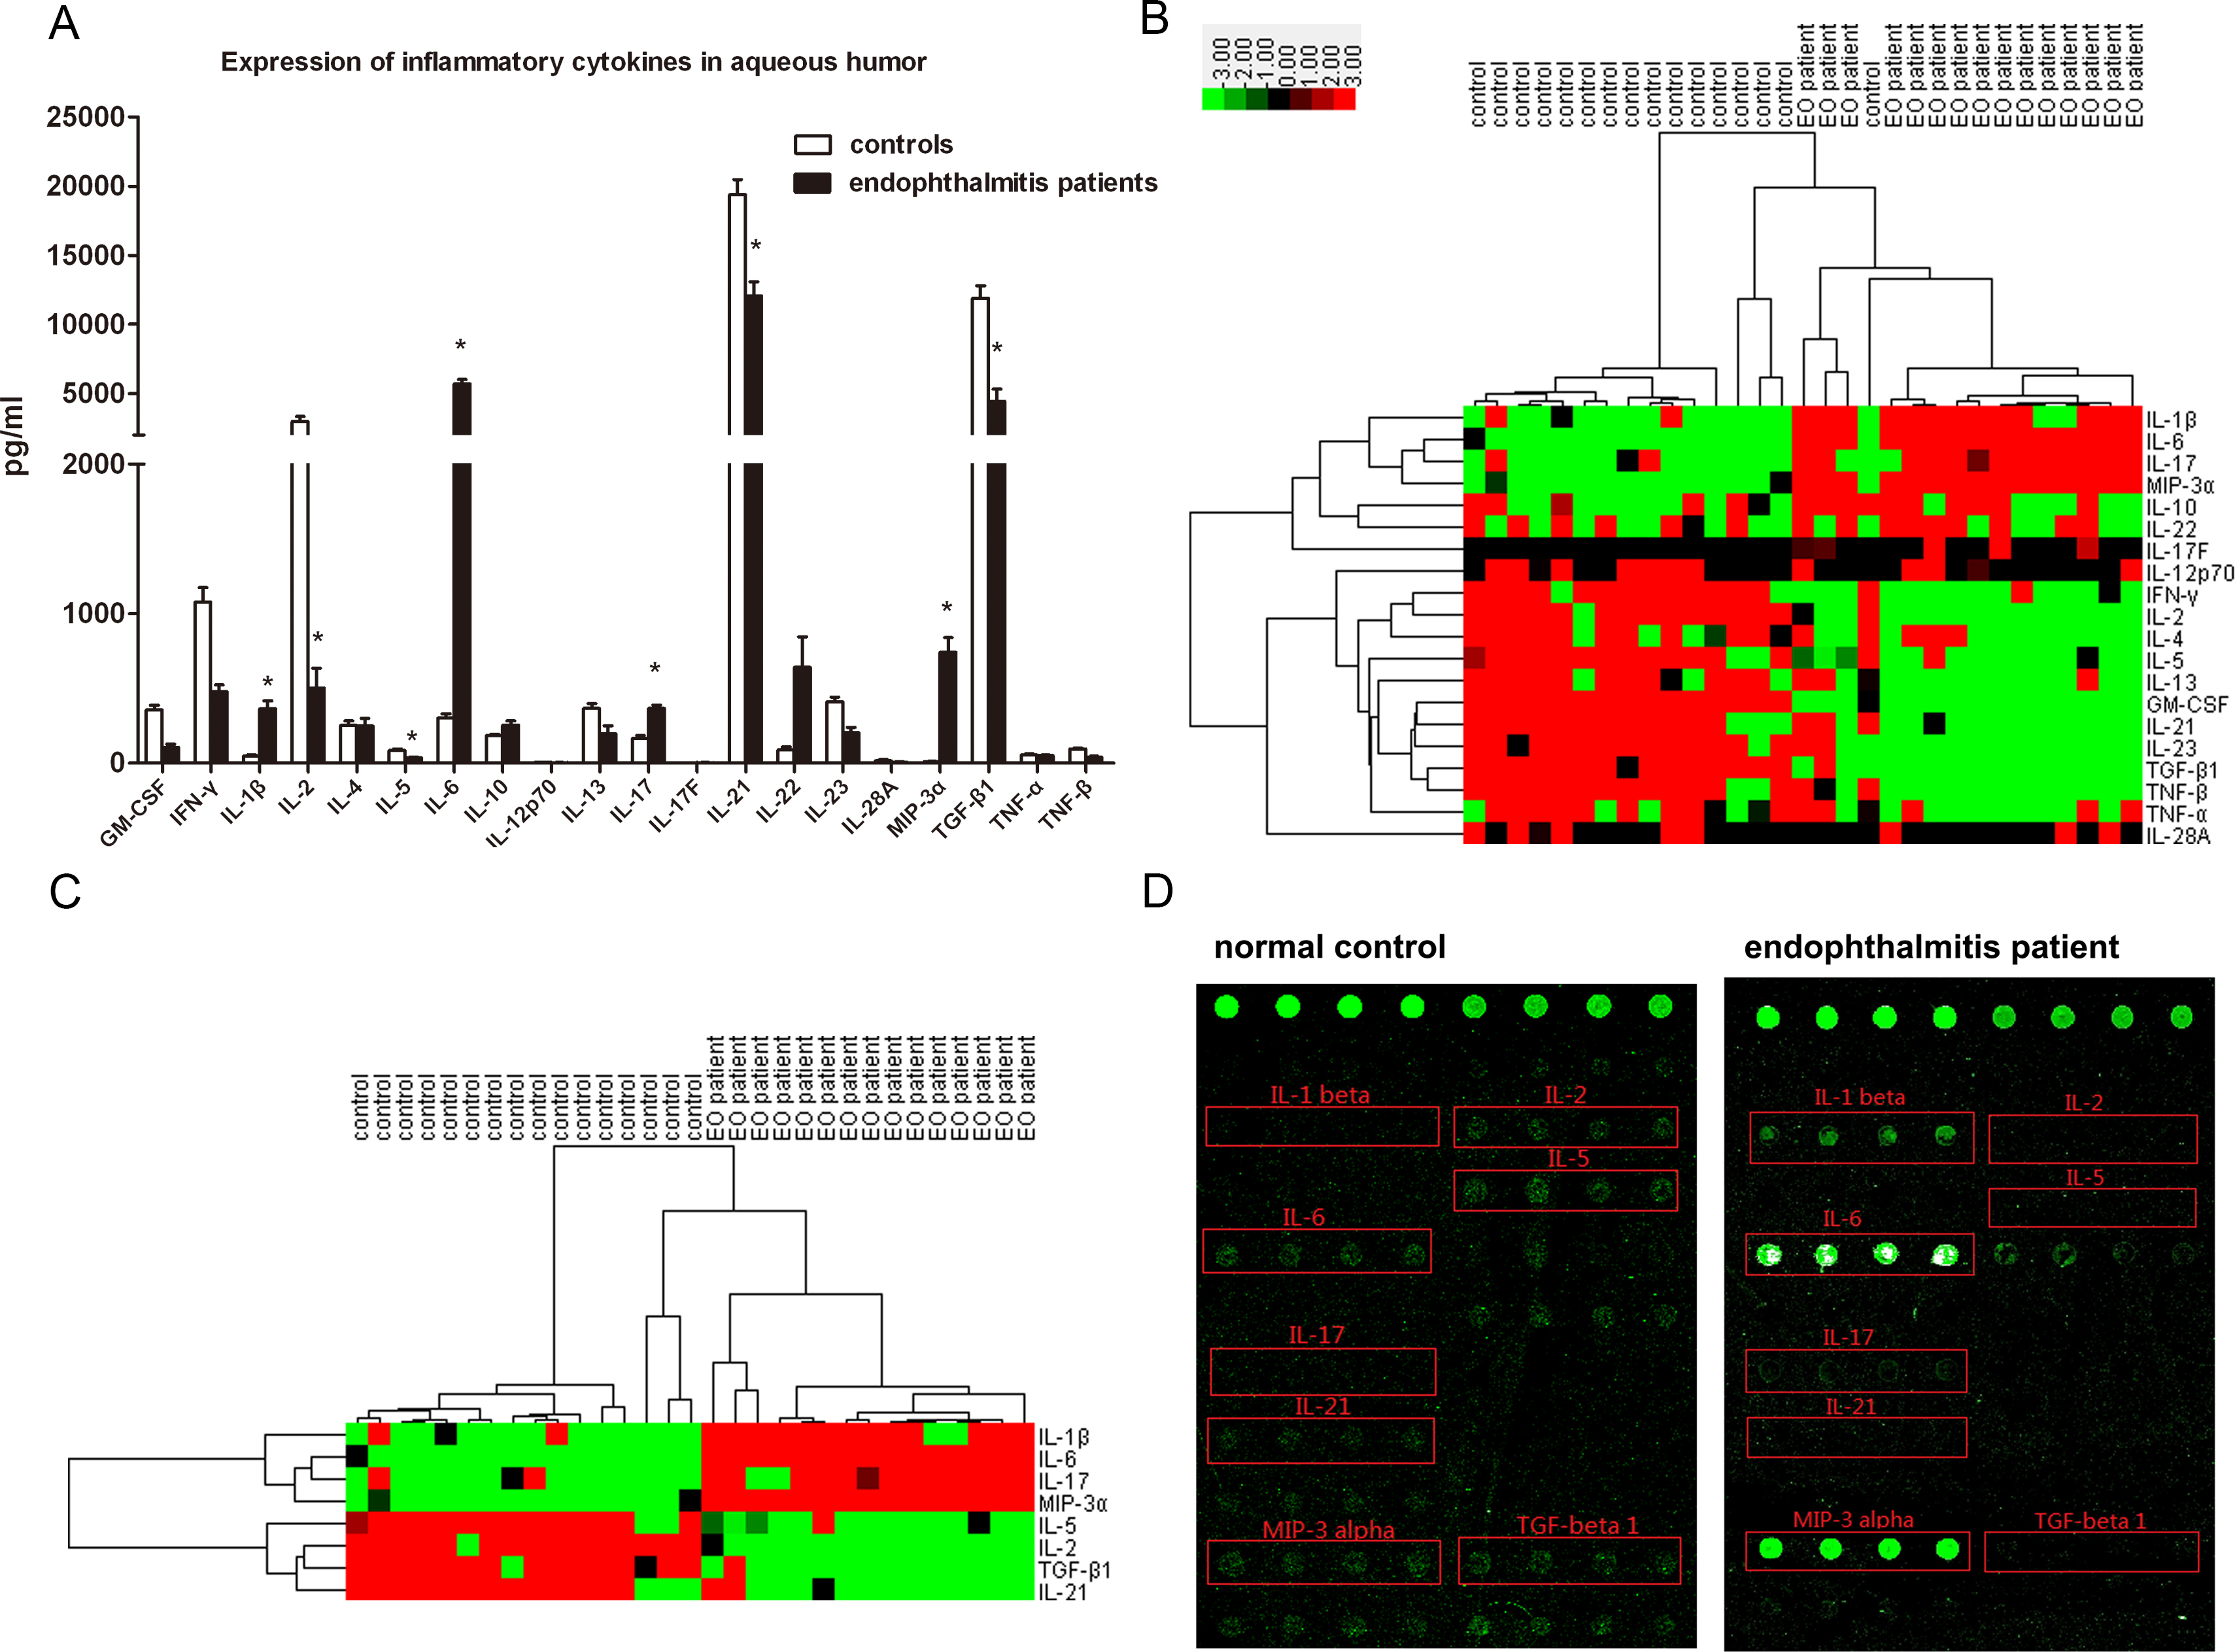
 Figure 2 of
Hao, Mol Vis 2016; 22:563-574.
Figure 2 of
Hao, Mol Vis 2016; 22:563-574.